
Introduction
Ever wondered how researchers know whether a sample truly represents a larger population?
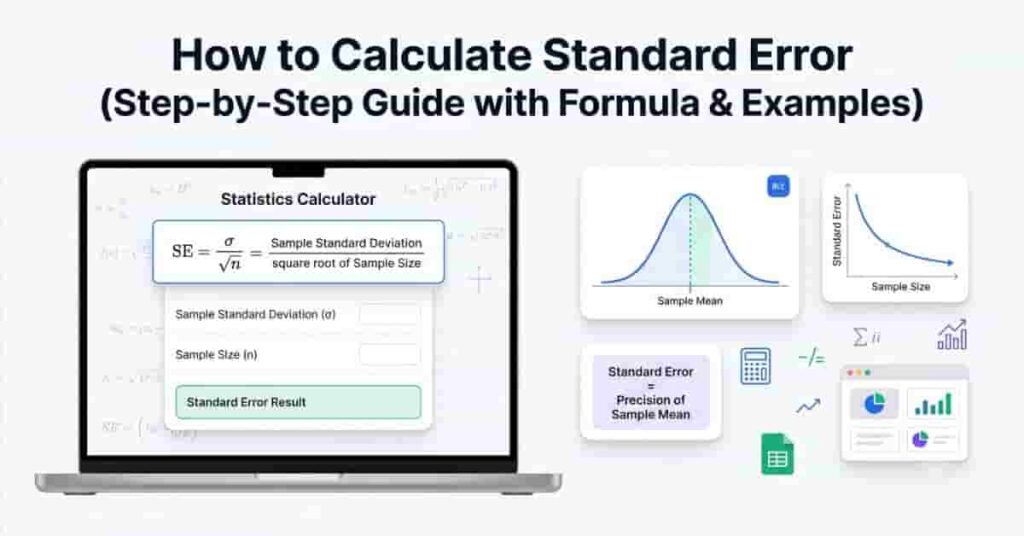
Learning how to calculate standard error is one of the most useful skills in statistics. It helps you measure how much a sample mean is likely to vary from the true population mean. Whether you’re a student, researcher, business professional, or data analyst in the USA, understanding this concept can help you make more confident decisions based on data. If you’ve ever felt confused about calculating standard error or wondered why it matters, you’re not alone.
Standard error plays an important role in surveys, scientific studies, quality control, market research, and many everyday statistical tasks. A smaller standard error suggests that your sample provides a more precise estimate of the population mean. Knowing how to calculate it correctly also helps you interpret results, compare datasets, and build confidence intervals with greater accuracy.
This guide will walk you through the complete process in simple, beginner-friendly steps. You’ll learn the standard error formula, what each variable means, and how to calculate standard error using a worked example. You’ll also discover how sample size affects standard error, how to interpret your results, and the most common mistakes to avoid. By the end, you’ll have the knowledge and confidence to calculate standard error accurately and understand what your results really mean.
What Is Standard Error?
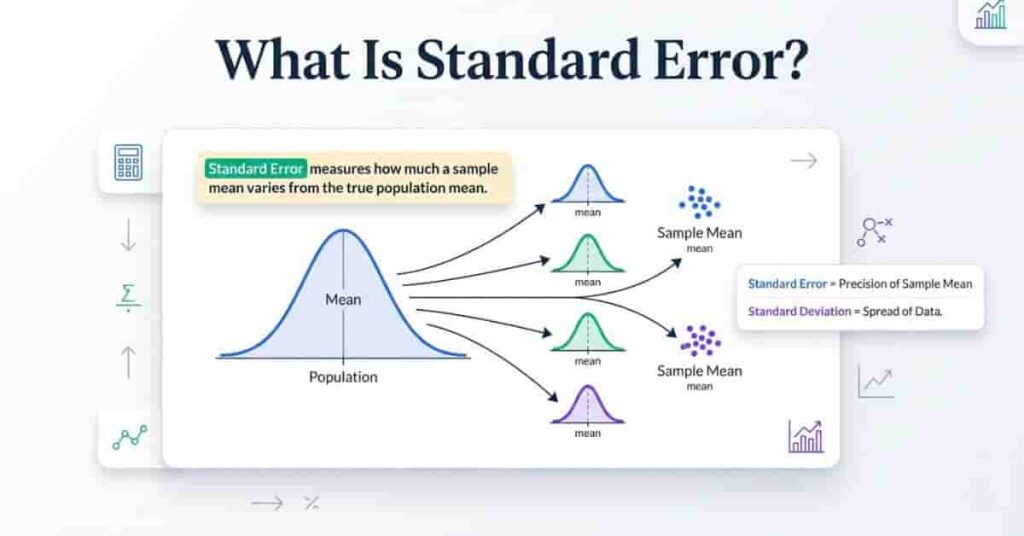
Standard error measures how much a sample mean is likely to vary from the true population mean. In simple terms, it tells you how precise your sample result is. A smaller standard error means your sample mean is more likely to be close to the actual population mean, while a larger standard error suggests greater uncertainty.
If you want to perform the calculation directly in a spreadsheet, learn how to calculate standard error in Google Sheets with formulas and a worked example.
Many beginners confuse standard error with standard deviation, but they measure different things. Standard deviation describes how spread out individual data values are within a dataset. Standard error, however, measures the variability of the sample mean if you were to collect many different samples from the same population. Because of this, standard error focuses on the reliability of your estimate rather than the spread of the raw data.
Researchers, students, and data analysts use standard error to understand how much confidence they can place in their results. It plays an important role in hypothesis testing, confidence intervals, opinion polls, scientific research, business analytics, and quality control. When the standard error is low, the sample provides a more precise estimate of the population mean. As the sample size increases, the standard error usually becomes smaller, improving the accuracy of statistical estimates.
Understanding standard error is essential before learning how to calculate standard error. Once you know what it represents, the calculation becomes much easier to understand and interpret. Instead of viewing it as another statistical formula, think of it as a tool that helps you judge how reliable your sample-based conclusions are.
Standard Error vs. Standard Deviation
| Measures the variability of the sample mean. | Measures the spread of individual data values. |
| Indicates the precision of an estimate. | Indicates the variability within a dataset. |
| Decreases as sample size increases. | Does not automatically decrease with a larger sample size. |
| Commonly used in confidence intervals and hypothesis testing. | Commonly used to describe the distribution of data. |
When Should You Calculate Standard Error?
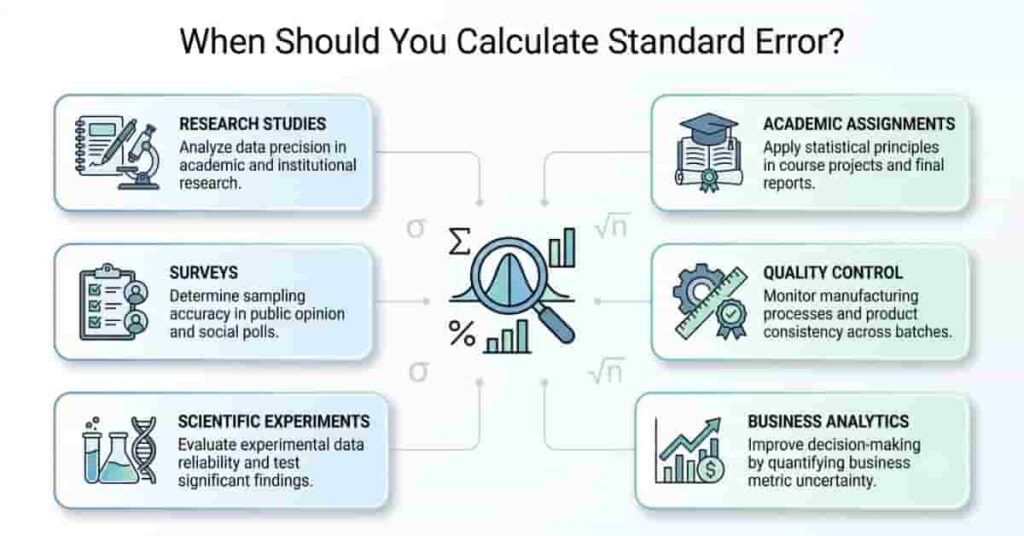
You should calculate standard error whenever you want to know how accurately a sample represents a larger population. It helps you measure the precision of your sample mean and understand how much your results might vary if you collected another sample. This makes standard error an important part of statistical analysis across many fields.
One of the most common uses is in research studies. Researchers calculate standard error to determine how reliable their findings are before drawing conclusions. It also helps them build confidence intervals and perform hypothesis tests.
In surveys, the standard error indicates how closely the results are likely to reflect the opinions of the entire population. Whether you’re conducting a customer satisfaction survey or a public opinion poll, a smaller standard error means the survey estimate is generally more precise.
Scientific experiments also rely on standard error to compare results across different groups or repeated trials. It helps scientists decide whether observed differences are meaningful or simply due to sampling variation.
Businesses use standard error in business analytics to evaluate sales trends, customer behavior, product performance, and marketing campaigns. By measuring the precision of sample data, companies can make better data-driven decisions.
In quality control, manufacturers use standard error to monitor production processes and check whether product measurements remain consistent over time. This helps identify potential problems before they affect product quality.
Students often calculate standard error in academic assignments for statistics, mathematics, economics, psychology, and other research-based courses. Understanding when and why to use it helps them interpret statistical results correctly and avoid common mistakes.
For Microsoft Excel users, this guide to calculating standard error in Excel shows how to use Excel formulas and the Data Analysis ToolPak.
Common Situations Where Standard Error Is Used
| Scenario | Why Standard Error Matters |
| Research studies | Measures the reliability of sample-based findings. |
| Surveys | Estimates how well the sample represents the population. |
| Scientific experiments | Evaluates the precision of experimental results. |
| Business analytics | Supports data-driven business decisions. |
| Quality control | Monitors consistency in products and processes. |
| Academic assignments | Helps students analyze and interpret statistical data. |
Key Takeaways
- Calculate standard error whenever you use sample data to estimate a population value.
- It improves the accuracy and interpretation of statistical results.
- Standard error is widely used in research, surveys, experiments, business, manufacturing, and education.
- A smaller standard error generally indicates a more precise estimate.
Formula for Calculating Standard Error
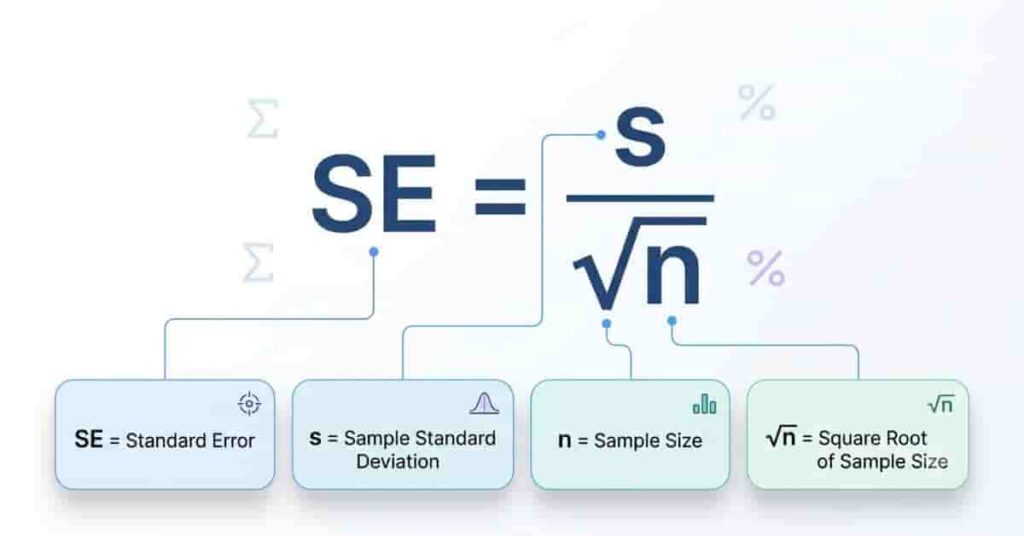
Before you learn how to calculate standard error, it’s important to understand the formula and what each part represents. The standard error formula combines the sample standard deviation with the sample size to estimate how precisely your sample mean reflects the population mean. As your sample size increases, the standard error usually becomes smaller, indicating a more reliable estimate.
Standard Error
SE = s⁄√n
Where:
- SE = Standard Error
- s = Sample standard deviation
- n = Sample size
- √n = Square root of the sample size
This formula works by dividing the sample standard deviation by the square root of the sample size. The standard deviation measures how spread out the data values are, while the square root of the sample size adjusts that spread based on the number of observations. Larger samples generally produce a smaller standard error because they provide more reliable estimates of the population mean.
What Each Symbol Means
| Symbol | Meaning | Description |
| SE | Standard Error | Measures the precision of the sample mean. |
| s | Sample Standard Deviation | Shows how much the sample values vary from the sample mean. |
| n | Sample Size | The total number of observations in the sample. |
| √n | Square Root of Sample Size | Reduces the effect of variability as the sample size increases. |
For example, suppose a sample has a standard deviation of 20 and a sample size of 64. The square root of 64 is 8, so the calculation becomes:
- SE = 20 ÷ 8
- SE = 2.5
This means the sample mean is expected to vary by about 2.5 units from the true population mean due to random sampling.
Pro Tip
Always verify that you’re using the sample standard deviation (s) rather than the population standard deviation (σ). Using the wrong value can lead to incorrect standard error calculations.
How to Calculate Standard Error (Step-by-Step)
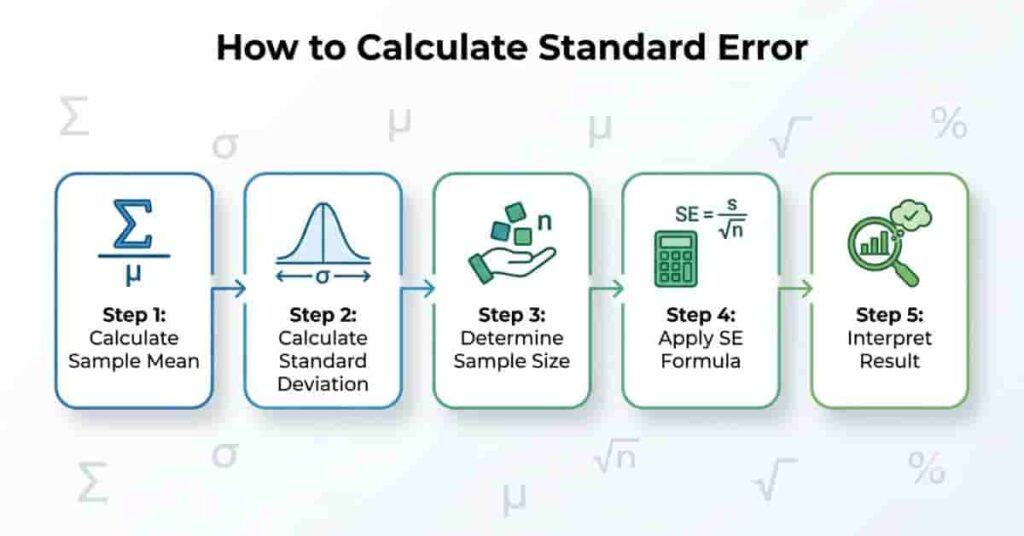
Calculating standard error is straightforward when you follow the correct sequence. First, find the sample mean and standard deviation. Next, determine the sample size and apply the standard error formula. Finally, interpret the result to understand how precisely your sample estimates the population mean.
Follow these five simple steps to calculate standard error accurately.
Standard error can also be derived when you know the confidence interval, so see how to calculate standard error from a confidence interval for the formula and step-by-step examples.
Step 1 — Calculate the Sample Mean
Begin by calculating the sample mean, also called the average. Add all the values in your dataset and divide the total by the number of observations. The sample mean serves as the foundation for calculating the standard deviation in the next step.
For example, suppose your dataset is:
12, 15, 18, 20, 25
- Add the values: 12 + 15 + 18 + 20 + 25 = 90
- Count the observations: 5
- Sample Mean = 90 ÷ 5 = 18
A correctly calculated mean ensures the remaining calculations are accurate.
Pro Tip
Double-check that you’ve included every observation before calculating the average. Missing even one value can affect the final standard error.
Step 2 — Calculate the Standard Deviation
Next, calculate the sample standard deviation. This measures how much the data values vary from the sample mean. If the values are close together, the standard deviation will be small. If they are spread out, it will be larger.
You can calculate the standard deviation manually, use a scientific calculator, or use software such as Excel, Google Sheets, SPSS, or R. Most beginners prefer software because it reduces calculation errors and saves time.
Remember to use the sample standard deviation (s) rather than the population standard deviation (σ). The standard error formula for sample data requires the sample standard deviation.
Pro Tip
If your software asks whether to calculate the sample or population standard deviation, always choose the sample option unless you’re working with an entire population.
Step 3 — Determine the Sample Size
The next step is to identify the sample size (n). This is simply the total number of observations in your dataset. Every data point counts as one observation.
For example:
| 8, 10, 12, 14 | 4 |
| 15 survey responses | 15 |
| 100 customer ratings | 100 |
Sample size directly affects the standard error. Larger samples generally produce smaller standard errors because they provide more reliable estimates of the population mean.
Pro Tip
Only count valid observations. Remove missing or invalid values before determining your sample size.
Step 4 — Apply the Standard Error Formula
Once you know the sample standard deviation and sample size, substitute both values into the standard error formula.
For example:
- Sample Standard Deviation (s) = 20
- Sample Size (n) = 64
Calculation:
- √64 = 8
- Standard Error = 20 ÷ 8
- Standard Error = 2.5
This value represents the expected variation of the sample mean due to random sampling.
Pro Tip
Calculate the square root of the sample size before dividing. This helps prevent common calculation mistakes.
Step 5 — Interpret the Result
The final step is understanding what your answer means. The standard error tells you how precisely your sample mean estimates the population mean.
A smaller standard error indicates that your sample mean is likely to be close to the true population mean. This suggests higher precision and greater confidence in your estimate.
A larger standard error indicates greater sampling variability. Your sample mean may differ more from the population mean, making the estimate less precise.
Keep in mind that standard error does not measure the spread of individual data values. It measures the precision of the sample mean, which is why it is commonly used in confidence intervals and hypothesis testing.
Pro Tip
Always interpret standard error alongside your study’s sample size and research context. The same standard error value may have different implications depending on the dataset. If you want to verify your calculations or save time, use our Standard Error Calculator to get instant results with step-by-step calculations and reduce the risk of manual errors.
Standard Error Calculation Example
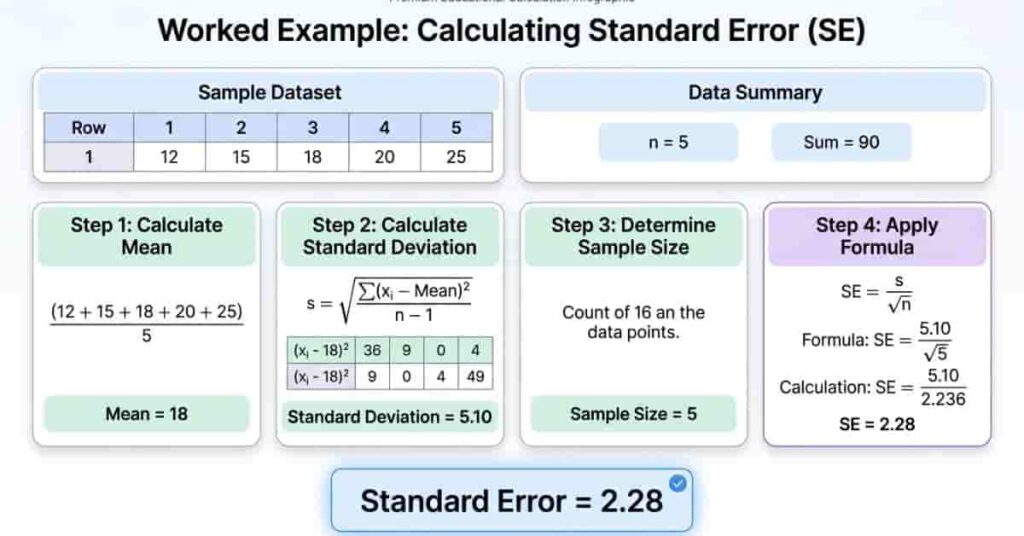
Now let’s put everything together with a complete example. Working through a real dataset is one of the easiest ways to understand how to calculate standard error. Follow each step carefully, and you’ll see how the final value is calculated.
Example Dataset
Suppose you collected the following sample data:
12, 15, 18, 20, 25
There are 5 observations in this dataset.
Step 1: Calculate the Sample Mean
Add all the values together and divide by the number of observations.
Mean = (12 + 15 + 18 + 20 + 25) ÷ 5
Mean = 90 ÷ 5
Mean = 18
The sample mean is 18.
Step 2: Calculate the Sample Standard Deviation
Next, calculate the sample standard deviation using the dataset.
For this example:
- Sample Standard Deviation (s) = 5.10 (rounded to two decimal places)
This value shows how much the data points vary around the sample mean.
Step 3: Determine the Sample Size
Count the total number of observations.
- Sample Size (n) = 5
Step 4: Apply the Standard Error Formula
Substitute the standard deviation and sample size into the formula.
Formula
SE = s / √n
Calculation
SE = 5.10 / √5
√5 ≈ 2.236
SE = 5.10 ÷ 2.236
SE ≈ 2.28
Final Answer
Standard Error ≈ 2.28
This means the sample mean is expected to vary by about 2.28 units from the true population mean due to random sampling.
Summary of the Calculation
| Dataset | 12, 15, 18, 20, 25 |
| Sample Mean | 18 |
| Sample Standard Deviation | 5.10 |
| Sample Size (n) | 5 |
| Formula | SE = s / √n |
| Standard Error | 2.28 |
Key Takeaways
- Start by calculating the sample mean.
- Find the sample standard deviation from the same dataset.
- Count the total number of observations.
- Divide the standard deviation by the square root of the sample size.
- The resulting standard error shows how precisely the sample mean estimates the population mean.
How Sample Size Affects Standard Error
Sample size has a direct impact on the standard error. One of the most important rules in statistics is that, as the sample size increases, the standard error usually decreases. This means larger samples tend to provide more precise estimates of the population mean.
A small sample contains fewer observations, so the sample mean is more likely to change if you collect another sample. This greater sampling variability leads to a larger standard error. As a result, estimates from small samples are generally less precise and should be interpreted with more caution.
A large sample includes more observations and better represents the population. Because the sample mean becomes more stable, the standard error decreases. A smaller standard error indicates that your estimate is more reliable and is likely to be closer to the true population mean.
This relationship exists because the standard error formula divides the standard deviation by the square root of the sample size (√n). As the sample size grows, the denominator increases, reducing the final standard error. However, increasing the sample size does not reduce the standard error in a straight line. The improvement decreases as the sample size continues to grow.
For example, doubling your sample size does not cut the standard error in half. Instead, you would need to increase the sample size by about four times to reduce the standard error by half.
Small Sample vs. Large Sample
| Small (e.g., 10–30 observations) | Higher | Lower precision |
| Medium (e.g., 31–99 observations) | Moderate | Moderate precision |
| Large (100+ observations) | Lower | Higher precision |
Example Comparison
Assume the sample standard deviation remains 20.
| 25 | 5 | 4.0 |
| 100 | 10 | 2.0 |
| 400 | 20 | 1.0 |
This example shows that increasing the sample size reduces the standard error, making the sample mean a more accurate estimate of the population mean.
How to Interpret Standard Error
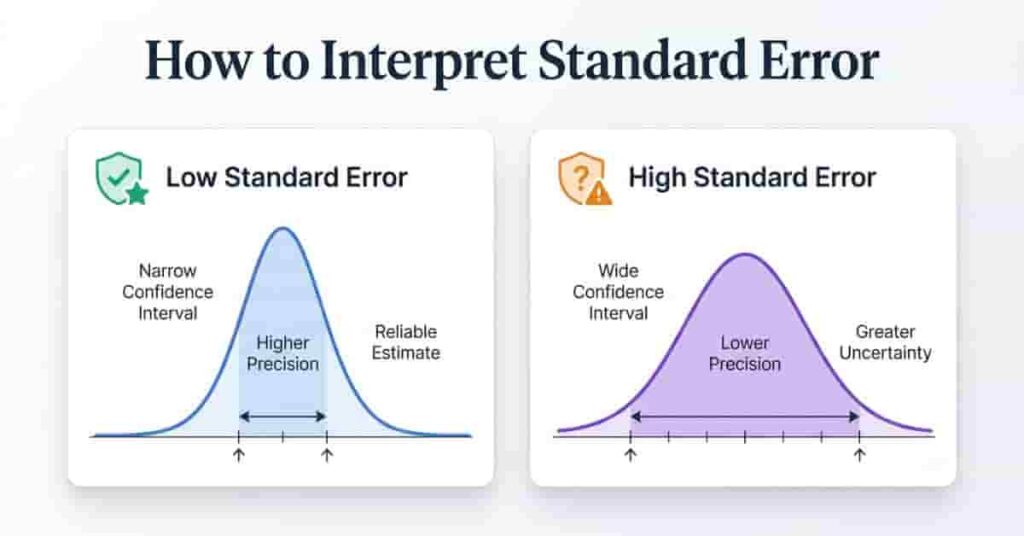
Calculating the standard error is only part of the process. The next step is understanding what the value tells you about your data. Standard error helps you judge how closely your sample mean is likely to represent the true population mean. In general, a smaller standard error indicates greater precision, while a larger standard error suggests more uncertainty.
Low Standard Error
A low standard error means the sample mean is likely to be very close to the true population mean. This usually happens when the sample size is large or the data values show relatively little variation.
For example, if two surveys use the same method but one has a lower standard error, its average result is generally considered more precise. Researchers often have greater confidence in estimates with smaller standard errors because they are less affected by random sampling variation.
High Standard Error
A high standard error indicates that the sample mean may vary more from the population mean. This often occurs when the sample size is small or the dataset has high variability.
A larger standard error does not mean the calculation is wrong. Instead, it shows that the estimate is less precise. In these situations, collecting more data may improve the reliability of the estimate.
Precision of the Sample Mean
Standard error measures the precision of the sample mean, not the spread of individual data values. The more precise the sample mean, the more closely it is expected to represent the population mean.
Think of it this way:
- Lower standard error = More precise estimate
- Higher standard error = Less precise estimate
This is why standard error is widely used when constructing confidence intervals and performing statistical tests.
Reliability of Estimates
Researchers use standard error to evaluate how reliable their sample-based estimates are. A smaller standard error generally leads to narrower confidence intervals and stronger confidence in the results. A larger standard error produces wider confidence intervals, indicating greater uncertainty.
However, standard error should never be interpreted by itself. Always consider the sample size, study design, and data quality before drawing conclusions. Even a small standard error cannot correct a biased sample.
Interpretation Guide
| Low | Sample mean is close to the population mean | High precision and more reliable estimates |
| Moderate | Some sampling variability exists | Reasonably reliable estimates |
| High | Sample mean may vary more from the population mean | Lower precision and greater uncertainty |
Mini Example
Suppose two studies estimate the average exam score.
- Study A: Standard Error = 1.2
- Study B: Standard Error = 4.8
Study A provides a more precise estimate because its standard error is much smaller. Study B’s estimate is still useful, but it has greater sampling uncertainty.
Common Mistakes When Calculating Standard Error
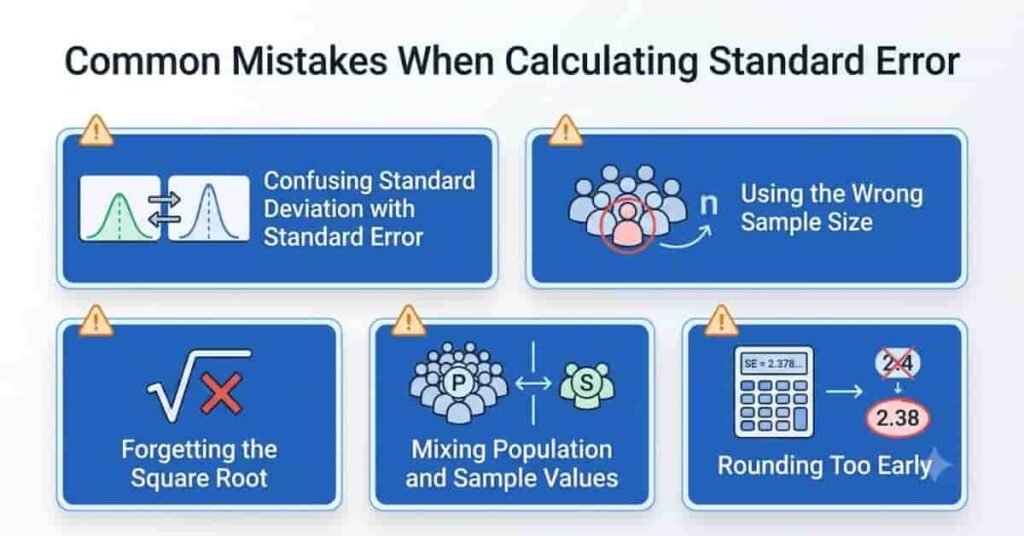
Even though the standard error formula is simple, small mistakes can produce incorrect results. Many beginners either confuse statistical terms or enter incorrect values into the formula. Understanding these common errors will help you calculate standard error more accurately and interpret your results with confidence.
1. Confusing Standard Deviation with Standard Error
One of the most common mistakes is treating standard deviation (SD) and standard error (SE) as the same measurement. They serve different purposes.
- Standard deviation measures how spread out individual data values are.
- Standard error measures how precisely the sample mean estimates the population mean.
Using one in place of the other can lead to incorrect conclusions about your data.
2. Using the Wrong Sample Size
Always use the correct number of observations in your sample. Counting missing values, duplicate entries, or invalid records can change the sample size and affect the final standard error.
Before starting your calculation, review your dataset and confirm that only valid observations are included.
3. Forgetting the Square Root
The standard error formula requires the square root of the sample size, not the sample size itself.
Correct:
SE = s ÷ √n
Incorrect:
SE = s ÷ n
This is a common calculation error that makes the standard error much smaller than it should be.
4. Mixing Population and Sample Values
Use values that match the formula you’re applying. If you’re working with sample data, use the sample standard deviation (s). Do not replace it with the population standard deviation (σ) unless you’re calculating the population standard error.
Mixing sample and population values can produce misleading results and affect later analyses, such as confidence intervals.
5. Rounding Too Early
Avoid rounding numbers during intermediate calculations. Rounding the mean, standard deviation, or square root too soon can introduce small errors that affect the final answer.
Keep several decimal places while calculating and round only the final standard error to the required number of decimal places.
Common Mistakes at a Glance
| Confusing SD with SE | Measures the wrong concept | Learn the difference before calculating |
| Using the wrong sample size | Produces an incorrect standard error | Count only valid observations |
| Forgetting the square root | Makes the calculation incorrect | Always divide by √n, not n |
| Mixing population and sample values | Uses the wrong formula inputs | Match the formula to your dataset |
| Rounding too early | Reduces calculation accuracy | Round only the final answer |
Standard Error vs. Standard Deviation
Many beginners use standard error and standard deviation interchangeably, but they measure different aspects of data. Understanding the difference is essential before interpreting statistical results. While both values involve variability, they answer different questions and serve different purposes.
Standard deviation (SD) measures how spread out individual data values are around the sample or population mean. It describes the variability within the dataset itself.
Standard error (SE) measures how much the sample mean is expected to vary from the true population mean. Instead of describing the data, it measures the precision of the estimate.
A simple way to remember the difference is this:
- Standard deviation describes the data.
- Standard error describes the estimate.
Researchers often report both values together because they provide different insights. Standard deviation helps readers understand the variability of the observations, while standard error shows how reliable the sample mean is.
Standard Error vs. Standard Deviation Comparison
| Purpose | Measures the precision of the sample mean. | Measures the spread of individual data values. |
| Formula | SE = s ÷ √n | Calculated from deviations of data values from the mean. |
| What It Measures | Sampling variability of the sample mean. | Variability within the dataset. |
| Interpretation | Smaller values indicate more precise estimates. | Smaller values indicate less variation among observations. |
| Effect of Sample Size | Usually decreases as sample size increases. | Does not automatically decrease with a larger sample size. |
| Typical Use Cases | Confidence intervals, hypothesis testing, research reports, survey analysis. | Descriptive statistics, data analysis, quality control, variability reporting. |
Example
Imagine two classrooms with the same average test score of 80.
- Class A has a low standard deviation because most students scored close to 80.
- Class B has a high standard deviation because scores vary widely.
Now suppose both classes are sampled multiple times.
- If the samples produce similar average scores each time, the standard error is low.
- If sample averages vary widely from one sample to another, the standard error is high.
This example shows that standard deviation measures the spread of individual scores, while standard error measures the precision of the average score.
Can You Calculate Standard Error Without Standard Deviation?
The short answer is sometimes. Whether you can calculate standard error without first calculating the standard deviation depends on the information you already have. If the standard deviation is provided, you can calculate standard error immediately. If it isn’t, you’ll need to find the standard deviation before applying the formula.
Understanding the difference between raw data and summary statistics will help you choose the correct approach.
When the Standard Deviation Is Already Known
If your dataset, textbook, research paper, or statistical software already provides the sample standard deviation (s), you can calculate the standard error right away.
Simply substitute the known values into the formula:
SE = s ÷ √n
For example, if:
- Sample Standard Deviation = 12
- Sample Size = 36
Then:
- √36 = 6
- SE = 12 ÷ 6 = 2
In this case, there is no need to calculate the standard deviation because it is already available.
When You Must Calculate the Standard Deviation First
If you’re working with raw data, the standard deviation is usually not provided. Before you can calculate standard error, you must first calculate the sample mean and then determine the sample standard deviation.
For example, if your dataset is:
8, 10, 12, 15, 20
You would:
- Calculate the sample mean.
- Calculate the sample standard deviation.
- Count the sample size.
- Apply the standard error formula.
Skipping the standard deviation step will make it impossible to calculate the standard error correctly from raw data.
Raw Data vs. Summary Statistics
The type of data you have determines your workflow.
| Raw data | Yes | No |
| Summary statistics (SD and sample size provided) | No | Yes |
If you’re analyzing data in Excel, Google Sheets, SPSS, or another statistics program, the software can usually calculate the standard deviation automatically. Once you have that value, calculating the standard error takes only a few seconds.
Conclusion
Learning how to calculate standard error is an important step toward understanding statistics with confidence. In this guide, you learned what standard error measures, how to use the formula, how sample size affects the result, and how to interpret your calculations correctly. You also discovered the difference between standard error and standard deviation, as well as common mistakes to avoid.
With regular practice, calculating standard error becomes much easier. Whether you’re completing a class assignment, analyzing survey results, or working on research, this skill helps you make more accurate, data-driven decisions.
If you want to save time and avoid manual calculations, try our Standard Error Calculator for instant results and step-by-step explanations. You can also explore our related statistics guides to strengthen your understanding. If you found this article helpful, share it with others or leave a comment below with your questions or experiences.

We are the StatisticsTools.com Development Team, dedicated to building accurate, easy-to-use statistical calculators and educational resources for students, educators, researchers, and professionals.
Our mission is to make statistics simple by providing free, reliable tools for data analysis, probability, hypothesis testing, regression, and other statistical calculations. We also create practical guides that explain statistical concepts in a clear and easy-to-understand way.
At StatisticsTools.com, we are continuously improving our platform by adding new calculators and educational resources to help users solve statistical problems quickly and confidently.