
Table of Contents
Introduction
Have you ever wondered why your Excel results don’t match the statistics in your textbook or research report? If you’re learning how to calculate standard error in Excel, you’re not alone. Many beginners find statistical formulas confusing at first. Thankfully, Excel makes the process much easier with built-in functions and simple formulas. Whether you’re a student, researcher, analyst, or business professional in the USA, knowing how to calculate standard error in Excel can help you analyze data more accurately and make better decisions.
In this guide, you’ll learn two reliable methods to calculate standard error in Excel. We’ll show you how to use a simple formula and the Excel Data Analysis ToolPak. You’ll also discover how Excel performs the calculation, how to add standard error bars to charts, and how to avoid common mistakes. By the end, you’ll be able to calculate standard error with confidence and verify your results using the correct Excel functions.
Need a faster way to calculate standard error? Enter your data into the calculator below and get accurate results in seconds.
What Is Standard Error in Excel?
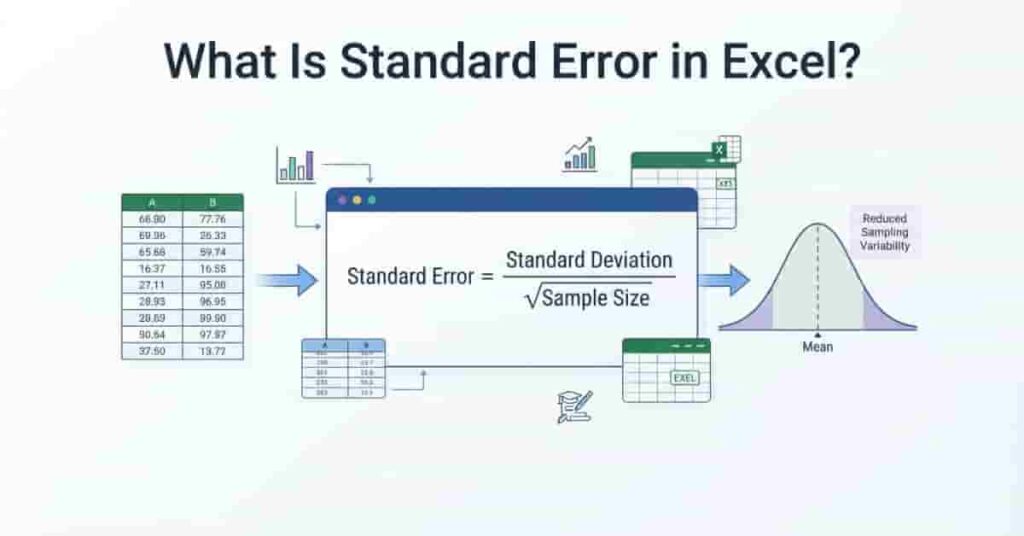
Standard error measures how much a sample mean is likely to vary from the true population mean. In simple terms, it tells you how reliable your sample average is. A smaller standard error means your sample is more likely to represent the larger population accurately.
Before applying the formula in Excel, it can help to understand how to calculate standard error manually and what the sample standard deviation and sample size represent.
If you’re learning how to calculate standard error in Excel, it’s important to know that Excel does not include a built-in STANDARDERROR() function. This often surprises beginners. Instead of using one dedicated function, Excel combines several statistical functions to calculate the result.
The most common formula is:
=STDEV.S(range)/SQRT(COUNT(range))
This formula uses:
- STDEV.S() to calculate the sample standard deviation.
- COUNT() to count the number of numeric values in your sample.
- SQRT() to find the square root of the sample size.
Excel also provides another option through the Data Analysis ToolPak. The Descriptive Statistics tool automatically calculates the standard error along with other useful statistics. This method works well if you want a complete statistical summary instead of entering formulas manually.
Takeaways
- Standard error measures how reliable a sample mean is.
- Excel does not have a
STANDARDERROR()function. - Use
STDEV.S(),COUNT(), andSQRT()together to calculate standard error. - The Data Analysis ToolPak can calculate standard error automatically.
Expert Tip: Use
STDEV.S()for sample data. If you’re working with an entire population, useSTDEV.P()instead.
Data You Need Before Calculating Standard Error
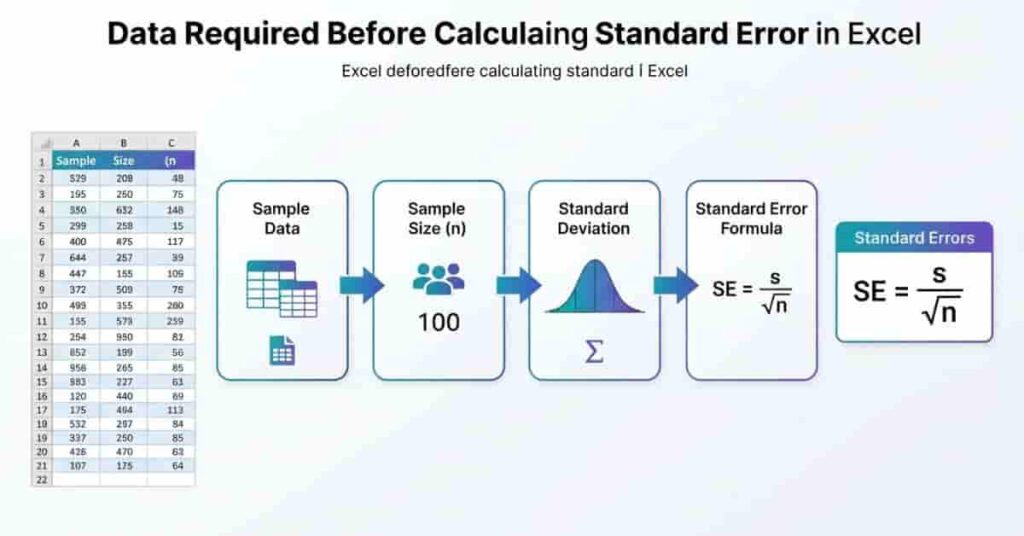
Before you calculate standard error in Excel, make sure you have the right data. The calculation depends on three key pieces of information. Missing or incorrect values can produce inaccurate results.
Instead of calculating standard error manually, use the calculator below to get accurate results instantly and verify your work.
Sample Data
Your sample data is the group of numbers you want to analyze. These values should come from a sample, not the entire population. For example, you might record test scores from 25 students or monthly sales from 12 stores.
Sample Size (n)
The sample size, written as n, is the total number of numeric values in your dataset. Excel calculates this using the COUNT() function. A larger sample usually produces a more reliable standard error because it better represents the population.
Standard Deviation
Standard deviation measures how spread out your data is. Excel calculates the sample standard deviation with the STDEV.S() function. This value is the foundation of the standard error calculation.
Formula Overview
Once you have your sample size and standard deviation, Excel calculates standard error with this formula:
Standard Error = STDEV.S(range) / SQRT(COUNT(range))
This formula divides the sample standard deviation by the square root of the sample size. As your sample size increases, the standard error usually becomes smaller.
If you use Google Sheets instead of Excel, this guide explains how to calculate standard error in Google Sheets with practical steps and spreadsheet formulas.
Formula for Standard Error in Excel
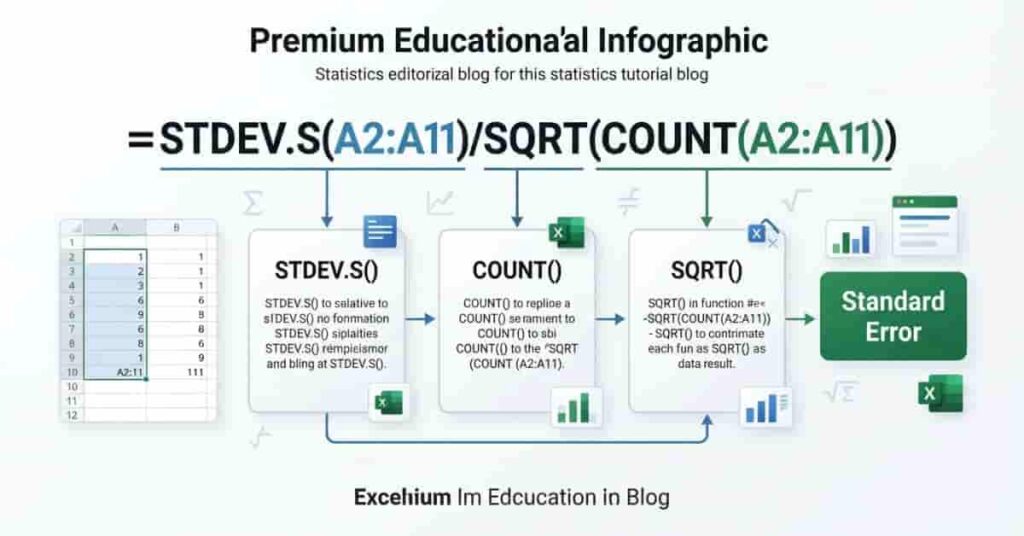
If you’re wondering how to calculate standard error in Excel, the formula is simple once you understand each part. Excel doesn’t calculate standard error with a single function. Instead, it combines three built-in functions to produce the correct result.
The standard Excel formula is:
=STDEV.S(range)/SQRT(COUNT(range))
This formula first calculates the sample standard deviation, then divides it by the square root of the sample size. The result is the standard error of your sample mean. As your sample size increases, the standard error usually becomes smaller because the sample provides a more reliable estimate of the population.
Want to double-check your Excel calculation? Use the Standard Error Calculator below to verify your answer in just a few seconds.
Understanding Each Function
STDEV.S(range)
The STDEV.S() function calculates the sample standard deviation. It measures how much the values in your dataset vary from the sample mean. Use this function when your data comes from a sample rather than an entire population.
Example:
=STDEV.S(A2:A11)
COUNT(range)
The COUNT() function counts the number of numeric values in your dataset. This value represents the sample size (n), which is required to calculate standard error.
Example:
=COUNT(A2:A11)
If your range contains 10 numbers, the function returns 10.
SQRT(number)
The SQRT() function returns the square root of a number. In the standard error formula, it calculates the square root of the sample size before dividing the standard deviation.
Example:
=SQRT(COUNT(A2:A11))
If your sample size is 25, SQRT(25) returns 5.
How the Formula Works Together
Suppose your data is stored in cells A2:A11. To calculate standard error in Excel, enter:
=STDEV.S(A2:A11)/SQRT(COUNT(A2:A11))
Excel automatically calculates the sample standard deviation, counts the observations, finds the square root of the sample size, and returns the standard error.
Standard error is also closely connected to confidence intervals, so you can learn how to calculate standard error from a confidence interval when working with reported interval values.
Method 1: Calculate Standard Error Using an Excel Formula (Recommended)
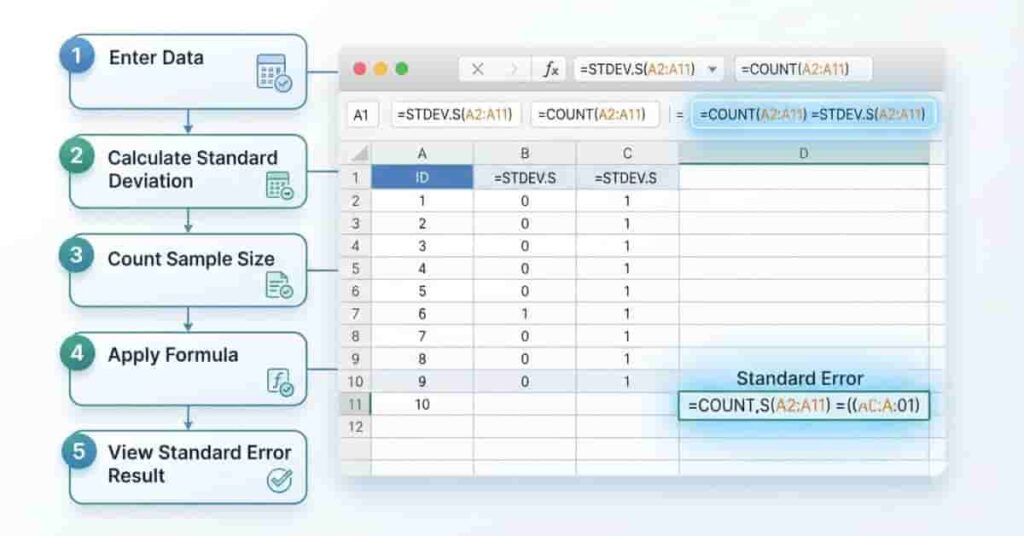
Using an Excel formula is the easiest and most flexible way to calculate standard error in Excel. It works in Microsoft Excel 365, Excel 2021, Excel 2019, and most earlier desktop versions. This method updates automatically whenever you change your data, making it ideal for homework, research, and business reports.
You’ll calculate the standard error in five simple steps. Each step builds on the previous one, so you can easily check your work and avoid common mistakes.
Step 1 — Enter Your Data
Start by entering your sample data into a single column or row. Each value should be in its own cell with no blank rows between them. For example, place your data in cells A2:A11.
Before moving to the next step, check that all values are numeric. Text entries, extra spaces, or accidental blank cells can affect your calculations.
Pro Tip: Add a header like Sample Data in cell A1. It makes your worksheet easier to read without affecting the formula.
Step 2 — Calculate Standard Deviation
The next step is to calculate the sample standard deviation. Excel uses the STDEV.S() function because your data represents a sample rather than an entire population.
Click an empty cell and enter:
=STDEV.S(A2:A11)Press Enter, and Excel will display the sample standard deviation. You’ll use this value in the final calculation.
Pro Tip: Don’t use
STDEV.P()unless your dataset includes every value in the population. Most classroom assignments and research projects requireSTDEV.S().
Step 3 — Count the Sample Size
Now determine the number of observations in your dataset. This value is called the sample size (n).
Use the following formula:
=COUNT(A2:A11)The COUNT() function returns the number of numeric values in the selected range. For example, if your dataset contains 10 numbers, the result will be 10.
Pro Tip: Use
COUNT()instead of counting values manually. It reduces errors and updates automatically when you add or remove data.
Step 4 — Apply the Standard Error Formula
After finding the standard deviation and sample size, you’re ready to calculate the standard error.
Enter this formula into an empty cell:
=STDEV.S(A2:A11)/SQRT(COUNT(A2:A11))Press Enter, and Excel will calculate the standard error instantly. The formula combines all three required functions into one calculation, so you don’t need to create separate formulas.
Pro Tip: If your dataset grows later, update the cell range or convert your data into an Excel Table so the formula expands automatically.
Step 5 — Verify the Result
Always verify your result before using it in a report or presentation. Compare the standard error with your sample size and standard deviation. A larger sample usually produces a smaller standard error.
You can also cross-check an online Standard Error Calculator. Matching results confirm that your formula and data range are correct.
Pro Tip: If your result seems unusually high or low, check for blank cells, text values, or an incorrect cell range before recalculating.
Method 2: Calculate Standard Error with Excel Data Analysis ToolPak
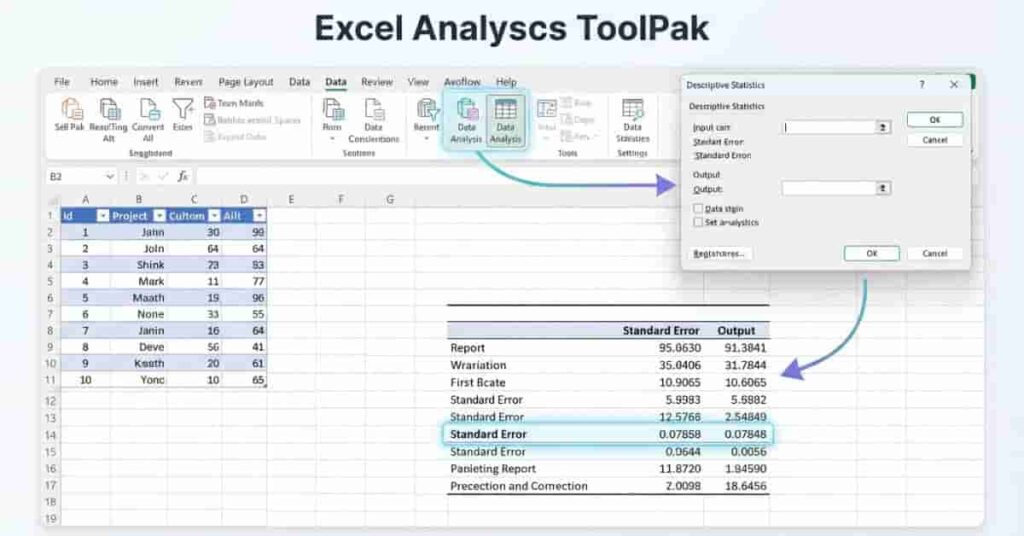
If you prefer a built-in statistical tool, Excel’s Data Analysis ToolPak can calculate the standard error for you. This method is useful when you need a complete statistical summary instead of a single calculation. Along with the standard error, it also reports the mean, median, standard deviation, variance, and other descriptive statistics.
The ToolPak is available in the desktop version of Microsoft Excel. If you don’t see the Data Analysis button, you may need to enable the add-in first.
Enable the Data Analysis ToolPak
If the Data Analysis option is missing from the Data tab, follow these steps:
- Click File > Options.
- Select Add-ins from the left menu.
- Choose Excel Add-ins from the Manage drop-down list.
- Click Go.
- Check Analysis ToolPak.
- Click OK.
After enabling it, you’ll find the Data Analysis button in the Analysis group on the Data tab.
Use Descriptive Statistics
Once the ToolPak is enabled, you can generate descriptive statistics in a few clicks.
- Select the Data tab.
- Click Data Analysis.
- Choose Descriptive Statistics and click OK.
- Select your input range, such as A2:A11.
- Check Summary Statistics.
- Choose an output location.
- Click OK.
Excel will create a new table containing several statistical measures.
Read the Output
The output includes values such as:
- Mean
- Median
- Standard Deviation
- Variance
- Minimum and Maximum
- Count
- Standard Error
Each statistic appears in its own row, making the report easy to read and share.
Where Standard Error Appears
Look for the row labeled Standard Error near the top of the descriptive statistics table. Excel calculates this value automatically using the sample standard deviation and sample size from your dataset.
This result should match the value you would get with the formula:
=STDEV.S(range)/SQRT(COUNT(range))
How Excel Calculates Standard Error
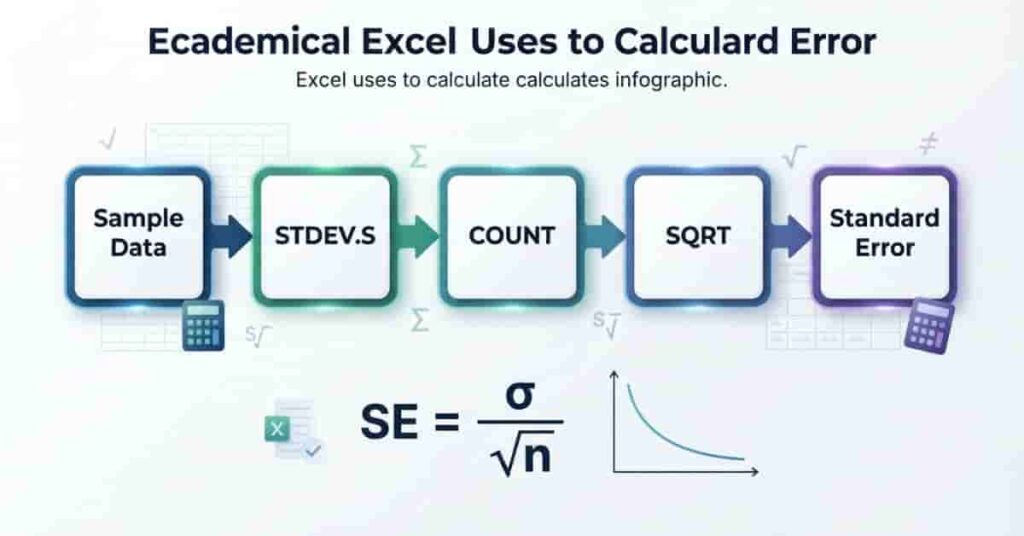
Many beginners ask, “How does Excel calculate standard error?” The answer is straightforward. Excel follows the same statistical formula used in textbooks and research. It does not use a hidden or different method. Instead, it combines the sample standard deviation with the sample size to calculate the standard error.
Whether you use a formula or the Data Analysis ToolPak, Excel performs the same mathematical calculation behind the scenes.
Internal Calculation
Excel calculates the standard error by dividing the sample standard deviation by the square root of the sample size.
The formula is:
Standard Error = Sample Standard Deviation ÷ √Sample Size
When you use:
=STDEV.S(range)/SQRT(COUNT(range))
Excel performs each calculation automatically and returns the final result.
Sample Standard Deviation
The STDEV.S() function measures how much your sample values vary around the sample mean. A larger standard deviation means the data is more spread out, which usually increases the standard error.
Because most users work with sample data, STDEV.S() is the correct function in almost every case.
Sample Size
The COUNT() function determines the sample size (n). Excel then calculates the square root of this value using SQRT().
As the sample size grows, the denominator becomes larger. This usually reduces the standard error, showing that larger samples provide more reliable estimates.
Why the Results Match the Manual Formula
Some users compare the ToolPak output with their own calculations. The values match because both methods use the same statistical equation. The ToolPak simply performs the calculation automatically and displays the result in a report.
If your manual result doesn’t match Excel, check for:
- Different cell ranges
- Blank or text cells
- Using
STDEV.P()instead ofSTDEV.S() - Incorrect sample size
How to Add Standard Error Bars in Excel Charts
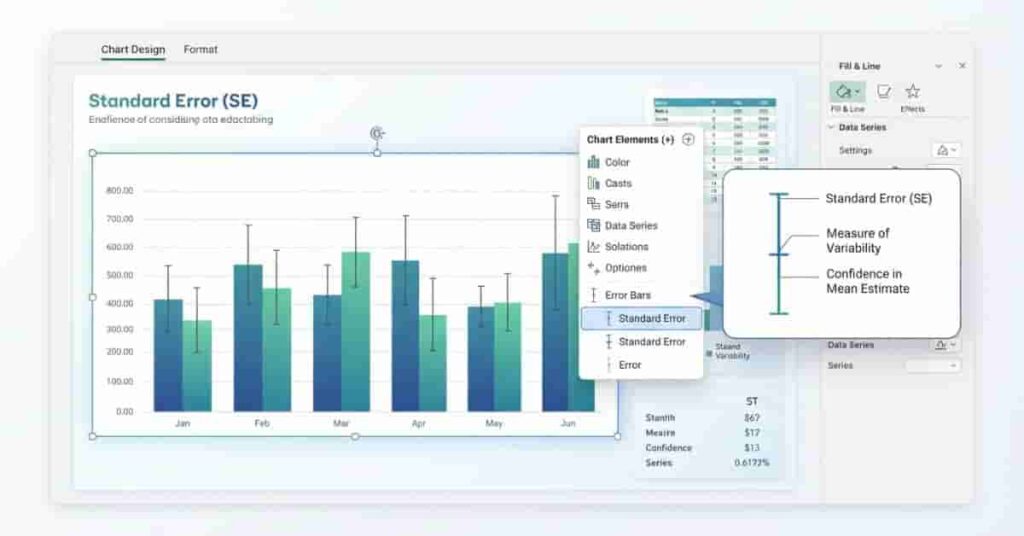
Standard error bars help you show how much uncertainty or variation exists around your data. They make charts easier to interpret and are commonly used in scientific research, business reports, and academic presentations. If you’re wondering how does Excel calculate standard error bars, Excel uses the standard error of your selected data series when you choose the built-in Standard Error option.
Select Your Chart
First, create a chart from your dataset. Standard error bars work with several chart types, including column, bar, line, and scatter charts.
To begin:
- Select your data range.
- Go to the Insert tab.
- Choose your preferred chart type.
- Click the chart to activate the Chart Design menu.
Add Error Bars
After selecting the chart:
- Click the green Chart Elements (+) button next to the chart.
- Check the Error Bars option.
- Click the arrow beside Error Bars to view more choices.
Excel adds default error bars immediately.
Choose Standard Error
From the Error Bars menu, select Standard Error.
Excel automatically calculates the standard error for the plotted values. It applies one standard error above and below each data point. This answers another common question: how does Excel calculate standard error for error bars? It uses the underlying dataset associated with the chart series to determine the standard error.
Use Custom Error Bars
Sometimes you need to display your own calculated values instead of Excel’s automatic calculation.
To create custom error bars:
- Click More Options under Error Bars.
- Choose Custom.
- Click Specify Value.
- Select the cell range containing your positive and negative error values.
- Click OK.
Custom error bars are useful when your values come from another calculation or statistical software.
Best Use Cases
Standard error bars improve charts when you want to show the reliability of sample data.
Common examples include:
- Scientific experiments
- Survey results
- Academic research
- Laboratory measurements
- Business performance comparisons
- Marketing and A/B testing reports
They help readers understand whether differences between groups are likely to be meaningful or simply caused by sampling variation.
Worked Example
Let’s walk through a simple example of how to calculate standard error in Excel. This example uses a small sample dataset so you can follow each step and verify your own results.
Sample Dataset
Suppose you have the following test scores:
| Student | Score |
|---|---|
| 1 | 72 |
| 2 | 75 |
| 3 | 80 |
| 4 | 78 |
| 5 | 82 |
| 6 | 76 |
| 7 | 79 |
| 8 | 81 |
| 9 | 77 |
| 10 | 74 |
Enter these values into cells A2:A11.
Excel Formula
Use the following formula to calculate the standard error:
=STDEV.S(A2:A11)/SQRT(COUNT(A2:A11))Excel first calculates the sample standard deviation with STDEV.S(). Next, it counts the number of observations with COUNT(). Finally, it divides the standard deviation by the square root of the sample size to return the standard error.
Result
For this sample dataset:
- Sample Size (n): 10
- Standard Deviation: Approximately 3.37
- Standard Error: Approximately 1.07
Your result may vary slightly because of decimal rounding or cell formatting.
This value means the sample mean is expected to vary by about 1.07 units from the true population mean.
Common Excel Errors and How to Fix Them
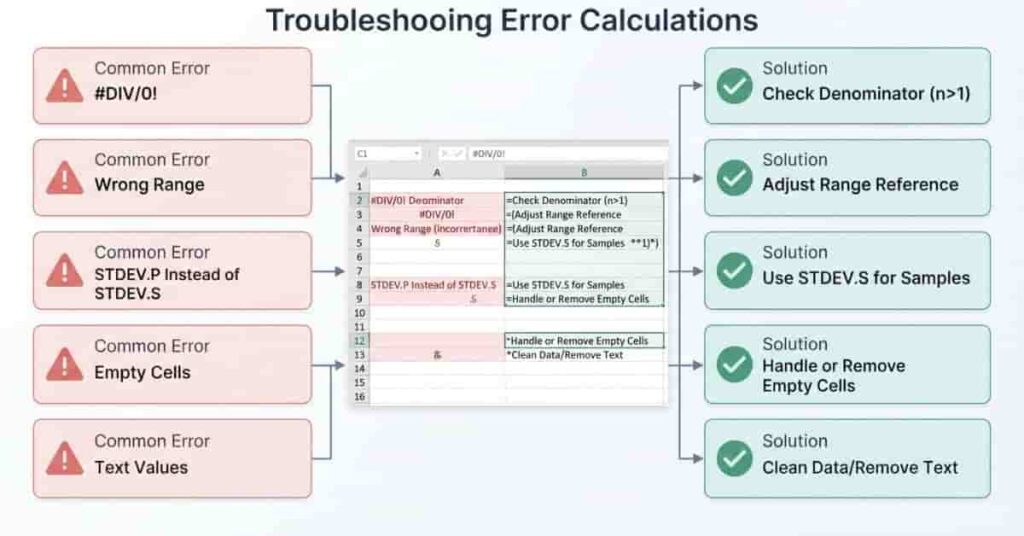
Even if you use the correct formula, small mistakes can produce incorrect results. Most standard error problems come from selecting the wrong data range or using the wrong Excel function. The good news is that these issues are easy to identify and fix.
Below are the most common errors you’ll encounter when calculating standard error in Excel.
| Error | Cause | How to Fix It |
|---|---|---|
| #DIV/0! | No numeric values or only one value in the dataset | Make sure your range contains at least two numeric values. |
| Wrong Range Selection | Selected the wrong cells or missed part of the dataset | Double-check that STDEV.S() and COUNT() use the exact same range. |
| Using STDEV.P Instead of STDEV.S | Used the population function for sample data | Replace STDEV.P() with STDEV.S() unless you have the entire population. |
| Empty Cells | Blank cells reduce the sample size or indicate missing data | Review your dataset and fill or remove missing values where appropriate. |
| Text Values | Text entries are ignored by COUNT() and can affect your analysis | Remove text or convert numeric text into real numbers before calculating. |
How to Troubleshoot Quickly
If your standard error looks too high or too low, check these items first:
- Confirm the correct cell range.
- Make sure your dataset contains only numeric values.
- Verify that you’re using
STDEV.S()for sample data. - Compare your result with the Data Analysis ToolPak.
- Review your formula for typing mistakes.
Many beginners accidentally select extra rows or exclude part of the dataset. Spending a few seconds checking your range can save a lot of time later.
Tips for More Accurate Standard Error Calculations in Excel
Accurate calculations start with clean, reliable data. Even a perfect formula can produce misleading results if your dataset contains errors. Following a few simple best practices will help you calculate standard error more confidently and avoid common mistakes.
Use Sample Data Correctly
Standard error is based on sample data, not an entire population. If your values represent only part of a larger group, use the STDEV.S() function. This ensures Excel applies the correct statistical method.
Check for Missing Values
Review your worksheet before running any calculations. Blank cells, duplicate entries, or incomplete records can affect your sample size and reduce accuracy.
Use Excel features like Filter, Sort, or Go To Special to identify missing values quickly.
Avoid Manual Calculations
Although you can calculate standard error by hand, Excel formulas are faster and less prone to mistakes. Using built-in functions also allows your results to update automatically whenever your data changes.
Verify Your Formulas
After calculating the standard error, review your formula one final time. Make sure the ranges used in STDEV.S() and COUNT() are identical. If possible, compare your answer with the Data Analysis ToolPak or your Standard Error Calculator to confirm the result.
Excel vs Manual Standard Error Calculation
You can calculate the standard error by hand or let Excel do the work. Both methods use the same statistical formula, so they should produce the same result when you use the same dataset. The main difference is the time and effort required.
For small datasets, manual calculations can help you understand how the formula works. However, Excel is much faster and reduces the risk of calculation errors. That’s why students, researchers, and analysts rely on Excel for most statistical tasks.
| Feature | Manual Calculation | Excel Formula |
|---|---|---|
| Accuracy | High if every step is correct | High when the correct formula and data range are used |
| Speed | Slow, especially for large datasets | Very fast and updates automatically |
| Ease of Use | Requires multiple calculation steps | One formula calculates the result instantly |
| Risk of Errors | Higher because of manual calculations | Lower because Excel performs the math automatically |
| Best for Learning | Understanding the calculation process | Applying the formula to real datasets |
| Best for Large Datasets | Not practical | Highly recommended |
| Best Scenarios | Homework, exams, learning statistics | Research, business reports, data analysis, recurring calculations |
If you’re new to statistics, try calculating the standard error manually once. After that, switch to Excel for faster and more reliable results. This approach helps you understand the concept while saving time on future calculations.
Calculating the standard error manually or in Excel is useful, but sometimes you need a faster solution. Our Free Standard Error Calculator gives you accurate results in seconds without requiring any Excel formulas or statistical experience.
Simply enter your sample data or the required values, and the calculator performs the calculation automatically. It’s an excellent tool for students checking homework, researchers verifying results, and professionals analyzing data.
Why Use Our Calculator?
- Instant calculation with no manual math.
- No Excel formulas required, making it beginner-friendly.
- Step-by-step solution so you can understand how the result is calculated.
- Cross-check Excel results to confirm your formulas are correct.
- Works on desktop, tablet, and mobile devices.
- Saves time when working with multiple datasets.
If you’ve already calculated the standard error in Excel, use the calculator as a quick verification tool. Matching results give you confidence that your data range and formula are correct before you submit a report or presentation.
Conclusion
Learning how to calculate standard error in Excel becomes much easier once you understand the formula and the tools Excel provides. In this guide, you learned how to use the standard error formula, the Data Analysis ToolPak, and standard error bars in charts. You also discovered common mistakes to avoid and practical tips for getting accurate results every time.
Whether you choose an Excel formula or a built-in feature, you can now calculate standard error in Excel with confidence. If you ever need a quick way to verify your answer, try our free Standard Error Calculator to cross-check your results. If you found this guide helpful, share it with classmates or colleagues, leave a comment with your questions, and explore our other Excel statistics tutorials and calculators to continue building your data analysis skills.
Use the Standard Error Calculator below to calculate standard error quickly and accurately. Enter your data, and the calculator will provide instant results with a step-by-step solution.

We are the StatisticsTools.com Development Team, dedicated to building accurate, easy-to-use statistical calculators and educational resources for students, educators, researchers, and professionals.
Our mission is to make statistics simple by providing free, reliable tools for data analysis, probability, hypothesis testing, regression, and other statistical calculations. We also create practical guides that explain statistical concepts in a clear and easy-to-understand way.
At StatisticsTools.com, we are continuously improving our platform by adding new calculators and educational resources to help users solve statistical problems quickly and confidently.