

Table of Contents
Introduction
Have you ever looked at a confidence interval and wondered how to find the standard error behind it?
If you’re learning statistics, knowing how to calculate standard error from confidence interval values is an essential skill. Researchers, students, and data analysts often need this calculation when reviewing research papers, completing assignments, or interpreting published results. Understanding this relationship helps you evaluate the precision and reliability of statistical estimates with greater confidence.
In this guide, you’ll learn the exact formula, understand why it works, and follow simple step-by-step examples that anyone can understand. We’ll also explain when this method is appropriate, how to choose the correct Z-score, and how to calculate confidence interval from standard error when working in the opposite direction. By the end, you’ll know how to perform the calculation accurately, avoid common mistakes, and verify your results using a free calculator.
If you already know the values from your confidence interval but want to double-check your standard error calculation, try our Standard Error Calculator.
Can You Calculate Standard Error from a Confidence Interval?
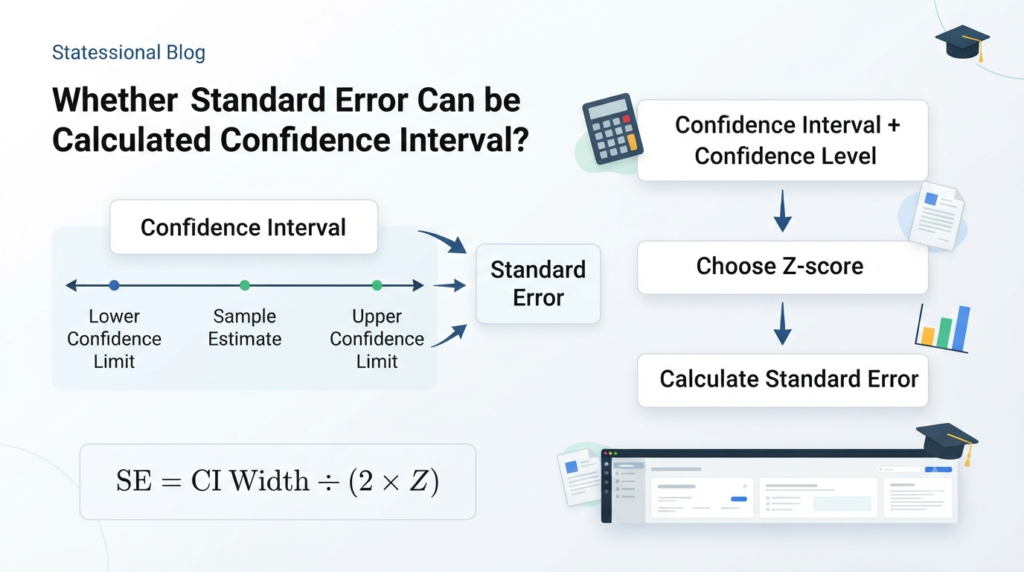
Yes, you can calculate standard error from a confidence interval if you know two key pieces of information: the confidence interval itself and the confidence level used to create it. This method is common in statistics because many research papers report confidence intervals but do not directly provide the standard error.
If you want to review the basic calculation first, our guide on how to calculate standard error explains the standard formula, sample size, standard deviation, and worked examples.
The calculation works because every confidence interval is built from a point estimate, a critical value (usually a Z-score), and the standard error. If you know the upper and lower confidence limits, you can work backward to estimate the standard error accurately.
This approach is appropriate when the confidence interval was calculated using a normal (Z) distribution. It is also suitable for studies with large sample sizes, where the sampling distribution is approximately normal. Many published studies use this method when reporting means, proportions, or regression estimates.
However, this method has some important assumptions. The confidence level must be known, such as 90%, 95%, or 99%. You also need to know whether the interval was based on a Z-score or a t-score. For small samples, researchers often use a t-distribution instead of a normal distribution. In those cases, replace the Z-score with the appropriate t-value to obtain the correct standard error.
If you want to verify your result, our Standard Error Calculator provides a quick way to calculate standard error using the relevant statistical values.
Takeaways
- You can calculate standard error if the confidence interval and confidence level are known.
- The method works best with normal distributions or large sample sizes.
- Use the correct critical value based on how the confidence interval was calculated.
- Check whether the study used a Z-score or a t-score before starting your calculation.
Expert Tip: When reading research papers, always check the methods section. It usually states whether the confidence interval was calculated with a Z-distribution or a t-distribution, helping you choose the correct formula.
Formula to Calculate Standard Error from a Confidence Interval
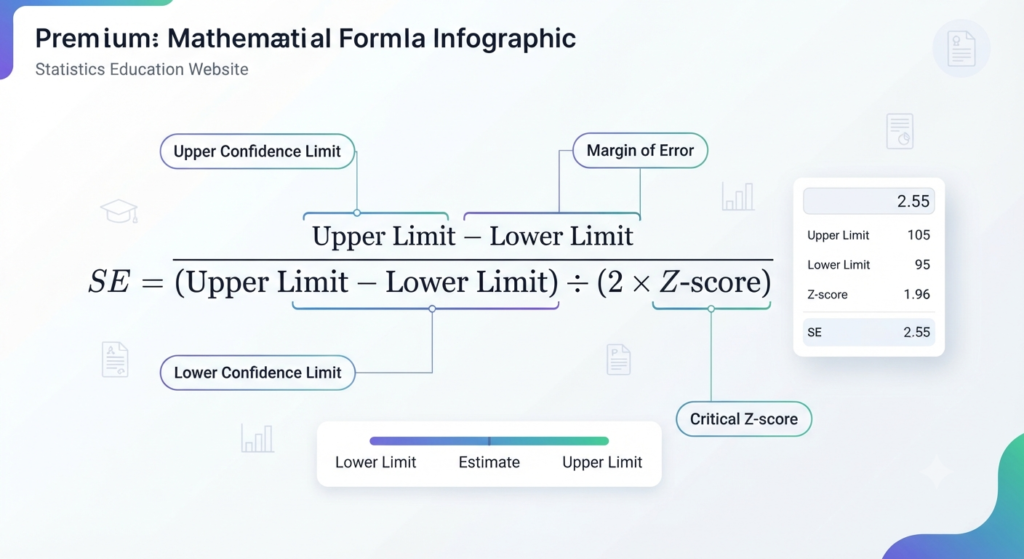
The formula below lets you calculate standard error from a confidence interval when you know the confidence limits and the corresponding Z-score.
SE=2×Z-scoreUpper Limit−Lower Limit
This formula comes from the relationship between the margin of error and the standard error. The width of a confidence interval equals twice the margin of error. Once you find the margin of error, divide it by the Z-score to calculate the standard error.
Here’s what each part of the formula means:
- Upper Confidence Limit: The highest value in the confidence interval.
- Lower Confidence Limit: The lowest value in the confidence interval.
- Z-score: The critical value for the selected confidence level, such as 1.645 for 90%, 1.96 for 95%, or 2.576 for 99%.
- Margin of Error (ME): Half the width of the confidence interval.
You can express this relationship as:
- Margin of Error = (Upper Limit − Lower Limit) ÷ 2
- Standard Error = Margin of Error ÷ Z-score
Using the correct Z-score is essential. A higher confidence level uses a larger Z-score, which affects the final standard error. If the original confidence interval was calculated with a t-distribution instead of a Z-distribution, replace the Z-score with the appropriate t-value.
For a spreadsheet-based approach, you can also learn how to calculate standard error in Google Sheets using a simple formula and a sample dataset.
Takeaways
- The formula uses the confidence interval width and the critical value.
- Always divide the interval width by two before calculating the standard error.
- Choose the correct Z-score for the reported confidence level.
- Use a t-value instead of a Z-score when the original analysis used a t-distribution.
Expert Tip: Write down the upper limit, lower limit, confidence level, and critical value before calculating. This simple checklist helps prevent common mistakes.
Z-Scores for Common Confidence Levels
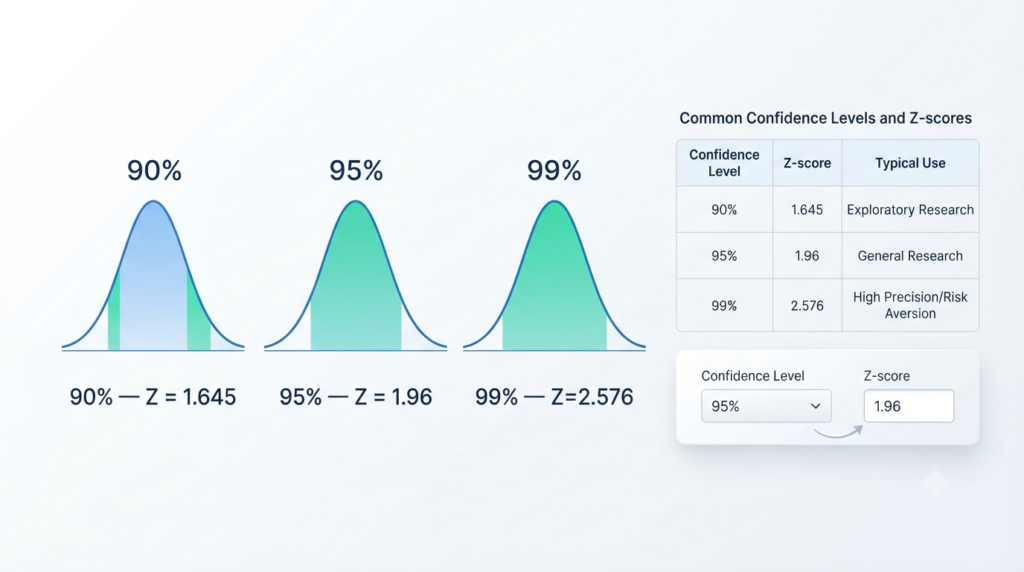
Choosing the correct Z-score is an important step when you calculate standard error from a confidence interval. The Z-score, also called the critical value, depends on the confidence level used to create the confidence interval. Using the wrong value will produce an incorrect standard error.
The table below lists the Z-scores most commonly used in statistics.
| Confidence Level | Z-Score |
|---|---|
| 90% | 1.645 |
| 95% | 1.96 |
| 99% | 2.576 |
After understanding these common confidence levels, this interactive visualization can help you see how changing the Z-score affects the width of a normal distribution interval.
Here’s when to use each Z-score:
- 90% Confidence Level (Z = 1.645): Use this value when a slightly lower confidence level is acceptable. It is common in exploratory studies and early-stage research.
- 95% Confidence Level (Z = 1.96): This is the most widely used confidence level in research, healthcare, business, and social sciences. Most published studies report 95% confidence intervals.
- 99% Confidence Level (Z = 2.576): Choose this value when you need greater certainty. A higher confidence level creates a wider confidence interval because it accounts for more possible variation.
As the confidence level increases, the Z-score also increases. A larger Z-score produces a larger margin of error, which leads to a wider confidence interval. This relationship is why selecting the correct critical value is essential when converting a confidence interval into a standard error.
Takeaways
- Match the Z-score to the reported confidence level.
- 1.645 is used for 90% confidence intervals.
- 1.96 is used for 95% confidence intervals.
- 2.576 is used for 99% confidence intervals.
- Using the wrong Z-score will change your standard error calculation.
Expert Tip: If a research paper does not mention the confidence level, don’t assume it is 95%. Always check the methods or statistical analysis section before choosing a Z-score.
How to Calculate Standard Error from a Confidence Interval (Step-by-Step)
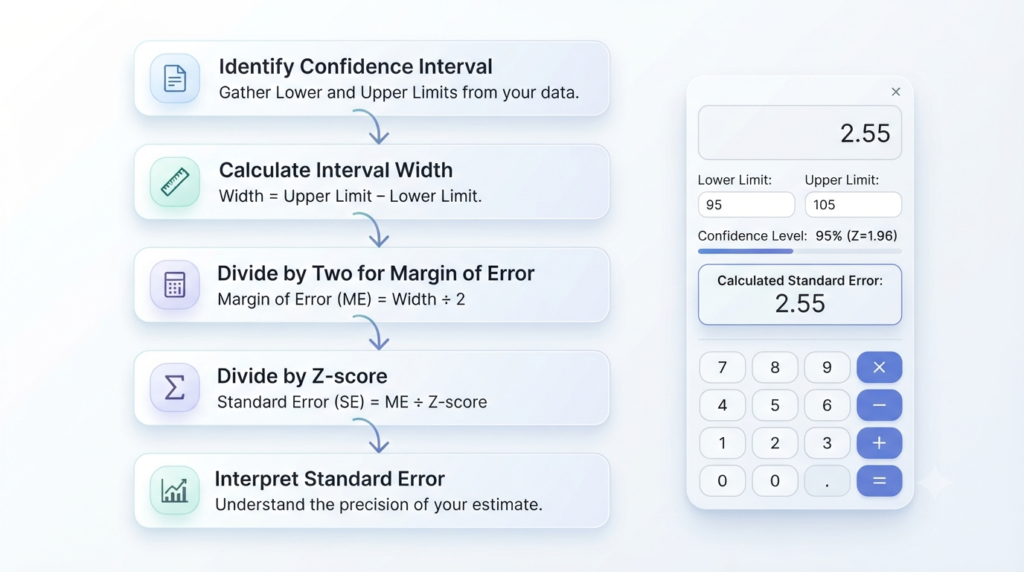
Once you know the confidence interval and confidence level, calculating the standard error is straightforward. You only need the upper confidence limit, lower confidence limit, and the correct Z-score. Following these five steps will help you calculate standard error from a confidence interval accurately and avoid common mistakes.
After calculating standard error from a confidence interval, you can use our standard error calculation tool to double-check your result.
Step 1 — Identify the Confidence Interval
Start by finding the reported confidence interval. It usually appears as two values, such as (42.3, 47.7). The first number is the lower confidence limit, and the second is the upper confidence limit.
Next, identify the confidence level used to create the interval. Most research papers use a 95% confidence interval, but some studies report 90% or 99% intervals instead. You need this information to select the correct Z-score.
Pro Tip: If the confidence level is not shown beside the interval, check the study’s methods or statistical analysis section before continuing.
Step 2 — Calculate the Width of the Interval
The next step is to find the total width of the confidence interval. Subtract the lower confidence limit from the upper confidence limit.
Formula:
Interval Width = Upper Limit − Lower Limit
For example, if the confidence interval is (42.3, 47.7):
- Interval Width = 47.7 − 42.3 = 5.4
The interval width shows the total range covered by the confidence interval. You will use this value to calculate the margin of error in the next step.
Pro Tip: Double-check that you subtract the lower limit from the upper limit. Reversing the values will give an incorrect result.
Step 3 — Divide by Two to Find the Margin of Error
A confidence interval extends equally above and below the estimated value. Because of this, the margin of error is always half of the interval width.
Formula:
Margin of Error = Interval Width ÷ 2
Using the previous example:
- Margin of Error = 5.4 ÷ 2 = 2.7
Many beginners forget this step and divide the interval width directly by the Z-score. Doing so doubles the standard error and produces the wrong answer.
Pro Tip: Think of the margin of error as the distance from the center estimate to either confidence limit.
Step 4 — Divide the Margin of Error by the Z-Score
Now calculate the standard error by dividing the margin of error by the appropriate Z-score.
Formula:
Standard Error = Margin of Error ÷ Z-score
For a 95% confidence interval, the Z-score is 1.96.
Using the example:
- Standard Error = 2.7 ÷ 1.96 ≈ 1.38
This is the standard error for the reported confidence interval.
Pro Tip: Use the Z-score that matches the reported confidence level. If the original analysis used a t-distribution, replace the Z-score with the appropriate t-value.
Step 5 — Interpret the Standard Error
The final step is to understand what the calculated standard error means. A smaller standard error shows that the estimate is more precise and that repeated samples would produce similar results. A larger standard error suggests greater variability and less precision.
Standard error does not describe the spread of individual observations. Instead, it measures how much the sample estimate is expected to vary from the true population value.
If two studies report similar averages, the study with the smaller standard error generally provides a more precise estimate.
Pro Tip: Always interpret the standard error together with the confidence interval. Looking at both values gives a clearer picture of the reliability of the estimate.
Expert Tip: When checking published research, perform the calculation yourself. It is a quick way to verify reported values and strengthen your understanding of statistical results.
Worked Example (95% Confidence Interval)
Let’s walk through a complete example to see how to calculate standard error from a confidence interval. This example uses a 95% confidence interval, which is the most common confidence level in research and statistics.
Once you have calculated the standard error from a confidence interval, it is useful to verify the result with our Standard Error Calculator.
Given Values
- Lower Confidence Limit: 42.3
- Upper Confidence Limit: 47.7
- Confidence Level: 95%
- Z-score: 1.96
Formula
SE=2×Z-scoreUpper Limit−Lower Limit
Step-by-Step Calculation
Step 1: Find the interval width47.7−42.3=5.4
Step 2: Calculate the margin of error5.4÷2=2.7
Step 3: Divide by the Z-score2.7÷1.96≈1.38
Final Answer
Standard Error (SE) ≈ 1.38
Interpretation
A standard error of 1.38 means the sample estimate is expected to vary by about 1.38 units from the true population value because of random sampling. A relatively small standard error suggests a more precise estimate, while a larger value indicates greater uncertainty.
Expert Tip: Work through the calculation one step at a time instead of using a single formula. This approach makes it easier to catch mistakes.
If your statistical work is done in Microsoft Excel, see this step-by-step guide to calculating standard error in Excel for formula-based calculations and Excel’s Data Analysis ToolPak.
Example Using a 90% Confidence Interval
The process stays the same for a 90% confidence interval. The only difference is the Z-score, which changes from 1.96 to 1.645.
Given Values
- Lower Confidence Limit: 18.5
- Upper Confidence Limit: 21.5
- Confidence Level: 90%
- Z-score: 1.645
Step-by-Step Calculation
Step 1: Calculate the interval width21.5−18.5=3.0
Step 2: Find the margin of error3.0÷2=1.5
Step 3: Calculate the standard error1.5÷1.645≈0.91
Final Answer
Standard Error (SE) ≈ 0.91
Because a 90% confidence interval uses a smaller Z-score than a 95% confidence interval, the resulting confidence interval is narrower when the same standard error is used. This example shows why selecting the correct critical value is essential for accurate calculations.
Takeaways
- The calculation steps remain the same.
- Only the Z-score changes with the confidence level.
- Use 1.645 for a 90% confidence interval.
- Always confirm the reported confidence level before starting.
Expert Tip: Create a small reference table with common Z-scores. It saves time and reduces calculation errors.
How Standard Error and Confidence Interval Are Related
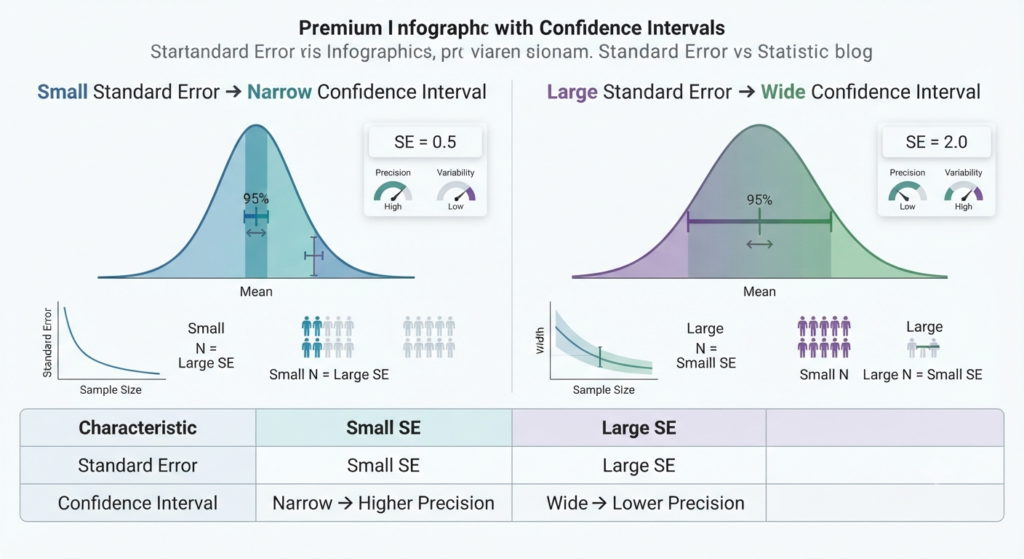
Standard error and the confidence interval measure the precision of a statistical estimate. They are closely connected because the confidence interval is calculated using the standard error. When the standard error changes, the width of the confidence interval changes as well.
A larger standard error creates a wider confidence interval. This means there is more uncertainty around the estimate. A smaller standard error creates a narrower confidence interval, indicating a more precise estimate.
Several factors affect the standard error:
- Sample Size: Larger samples usually produce smaller standard errors, resulting in narrower confidence intervals.
- Variability: Data with greater variability produce larger standard errors and wider confidence intervals.
- Confidence Level: Higher confidence levels require larger critical values, making confidence intervals wider even if the standard error stays the same.
The relationship can be summarized below.
| Standard Error | Confidence Interval | Interpretation |
|---|---|---|
| Small | Narrow | More precise estimate |
| Large | Wide | Less precise estimate |
| Larger sample size | Narrower | Higher precision |
| Greater variability | Wider | More uncertainty |
Understanding this relationship helps you interpret research findings more accurately. If two studies report similar averages, the one with the smaller standard error and narrower confidence interval usually provides the more reliable estimate.
Common Mistakes When Calculating Standard Error from a Confidence Interval
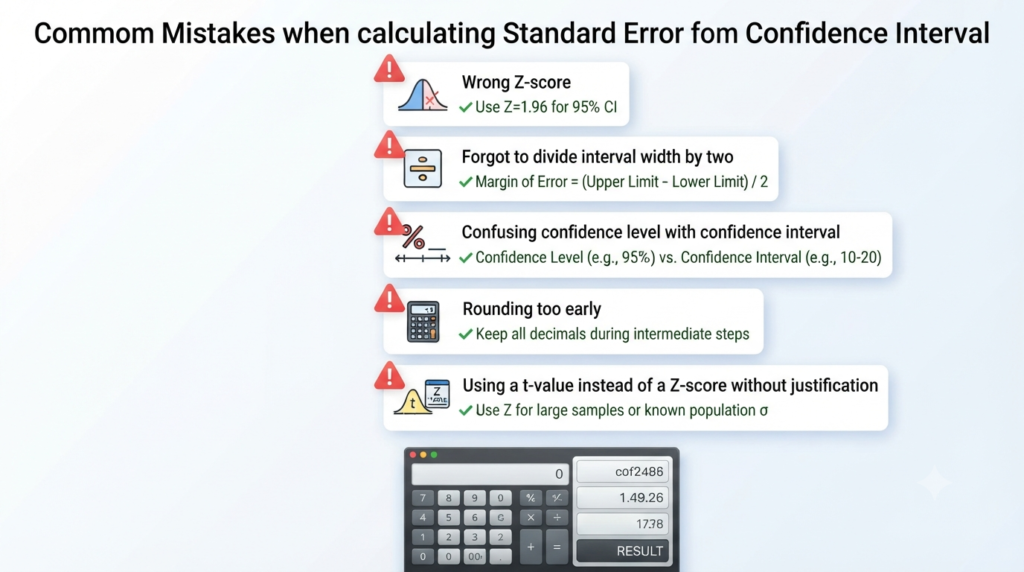
Learning how to calculate standard error from a confidence interval is straightforward, but a few common mistakes can lead to incorrect answers. Taking a few extra moments to review your calculations can help you avoid these errors and improve your accuracy.
1. Using the Wrong Z-Score
The Z-score depends on the confidence level. For example, a 95% confidence interval uses a Z-score of 1.96, while a 90% confidence interval uses 1.645. Choosing the wrong critical value changes the final standard error.
2. Forgetting to Divide the Interval Width by Two
Many beginners calculate the interval width correctly but forget to divide it by two before dividing by the Z-score. Remember, the margin of error is half the confidence interval width, not the full width.
3. Mixing Up the Confidence Level and Confidence Interval
A confidence level is a percentage, such as 90%, 95%, or 99%. A confidence interval is the numerical range, such as (42.3, 47.7). These terms are related but represent different concepts.
4. Rounding Too Early
Avoid rounding during intermediate calculations. Keep several decimal places until the final step. Early rounding can introduce small errors that affect your final result.
5. Using a t-Value Instead of a Z-Score Without Justification
The standard formula uses a Z-score only when the original confidence interval was calculated with a normal distribution. If the study used a t-distribution, you must replace the Z-score with the appropriate t-value. Using the wrong critical value produces an inaccurate standard error.
Expert Tip: Before calculating, make a quick checklist of the confidence interval, confidence level, critical value, and formula. This simple habit prevents most calculation mistakes.
When This Method Should Not Be Used
Although this formula is useful, it does not work in every situation. Before you calculate standard error from a confidence interval, make sure you have enough information and that the assumptions behind the formula are satisfied.
Unknown Confidence Level
You must know the confidence level used to create the confidence interval. Without it, you cannot choose the correct critical value. As a result, you cannot calculate the standard error accurately.
Insufficient Information
A confidence interval alone is not always enough. If the interval is incomplete or the study does not explain how it was calculated, your result may not be reliable. Always review the statistical methods before performing the calculation.
Small Samples Requiring a t-Distribution
For small sample sizes, researchers often use a t-distribution instead of a normal distribution. In these cases, replace the Z-score with the correct t-value. Using the Z-score for a confidence interval based on a t-distribution can produce an incorrect standard error.
Incorrect Statistical Assumptions
This method assumes the reported confidence interval was calculated correctly and that the appropriate statistical distribution was used. If these assumptions are not met, the calculated standard error may not reflect the true uncertainty of the estimate.
Use Our Free Standard Error Calculator
Manual calculations are a great way to understand statistics, but they can take time and small mistakes are easy to make. Our free Standard Error Calculator helps you calculate standard error instantly from your sample statistics while giving you confidence in your results.
Whether you’re working on a homework assignment, checking a research paper, or analyzing data, the calculator provides fast and accurate results. You can also use it to verify your manual calculations after following the formulas explained in this guide.
With our calculator, you can:
- Calculate standard error instantly from sample statistics.
- Verify answers you calculated by hand.
- View step-by-step calculations to understand how each result is produced.
- Save time and reduce calculation errors.
- Practice statistical concepts with confidence.
If you’re still learning how to calculate standard error from a confidence interval, use the calculator after completing your manual work. Comparing both methods is an excellent way to strengthen your understanding and catch any mistakes before submitting assignments or interpreting research results.
conclusion
Knowing how to calculate standard error from confidence interval values helps you understand the precision of statistical results and interpret research with greater confidence. You learned the formula, the role of the Z-score, common mistakes to avoid, and worked through practical examples. You also saw how to calculate confidence interval from standard error and why choosing the correct critical value matters.
If you’re solving assignments or checking published studies, use these steps to verify your calculations with confidence. For even faster results, try our free Standard Error Calculator and compare your manual answers. If you found this guide helpful, share it with classmates or colleagues and explore our other statistics guides and calculators to continue building your data analysis skills.
Frequently Asked Questions
Find quick answers to the most common questions about calculating standard error from a confidence interval.
Yes. You can calculate standard error from a confidence interval if you know the confidence interval’s upper and lower limits and the confidence level used to create it. The confidence level determines the correct critical value, such as a Z-score or t-value. Once you identify these values, calculate the interval width, find the margin of error, and divide it by the appropriate critical value to obtain the standard error.
The standard formula is SE = (Upper Limit − Lower Limit) ÷ (2 × Z-score). This formula works when the confidence interval was calculated using the standard normal (Z) distribution. First calculate the confidence interval width, divide it by two to find the margin of error, and then divide by the correct Z-score. If the interval was based on a t-distribution, use the appropriate t-value instead.
The Z-score represents the critical value for a chosen confidence level. It determines how far the confidence interval extends above and below the sample estimate. Since the margin of error equals the Z-score multiplied by the standard error, dividing the margin of error by the Z-score allows you to calculate the standard error. Use a t-value instead when the original confidence interval was based on a t-distribution.
For a 95% confidence interval, use a Z-score of 1.96 when the interval was created using the standard normal distribution. This is the most commonly used confidence level in statistics and research. If the original analysis used a t-distribution, replace 1.96 with the appropriate t-value.
Yes, but only when the original confidence interval was calculated using a t-distribution. This typically applies to smaller sample sizes or situations where the population standard deviation is unknown. Using the correct critical value ensures your standard error calculation remains accurate.
Yes. This method works for any confidence level as long as you use the correct critical value. For example, use 1.645 for a 90% confidence interval, 1.96 for a 95% confidence interval, and 2.576 for a 99% confidence interval. If a t-distribution was used, substitute the correct t-value.
A wider confidence interval generally indicates greater uncertainty in the estimate. This may result from a larger standard error, greater variability, a smaller sample size, or a higher confidence level. Narrower confidence intervals usually indicate more precise estimates.
Yes. If you know the standard error, the sample estimate, and the appropriate critical value, you can calculate a confidence interval using the formula: Confidence Interval = Estimate ± (Critical Value × Standard Error). This is the reverse of calculating standard error from a confidence interval.
No. Standard error measures the expected variation of a sample estimate across repeated samples. Margin of error equals the standard error multiplied by the appropriate critical value, such as a Z-score or t-value. Although related, they describe different statistical concepts.
Yes. A Standard Error Calculator lets you verify manual calculations in seconds. Simply enter your sample statistics or confidence interval values to receive accurate results. Many calculators also display step-by-step calculations, making them ideal for homework, research, and data analysis.

We are the StatisticsTools.com Development Team, dedicated to building accurate, easy-to-use statistical calculators and educational resources for students, educators, researchers, and professionals.
Our mission is to make statistics simple by providing free, reliable tools for data analysis, probability, hypothesis testing, regression, and other statistical calculations. We also create practical guides that explain statistical concepts in a clear and easy-to-understand way.
At StatisticsTools.com, we are continuously improving our platform by adding new calculators and educational resources to help users solve statistical problems quickly and confidently.