
Table of Contents
Introduction
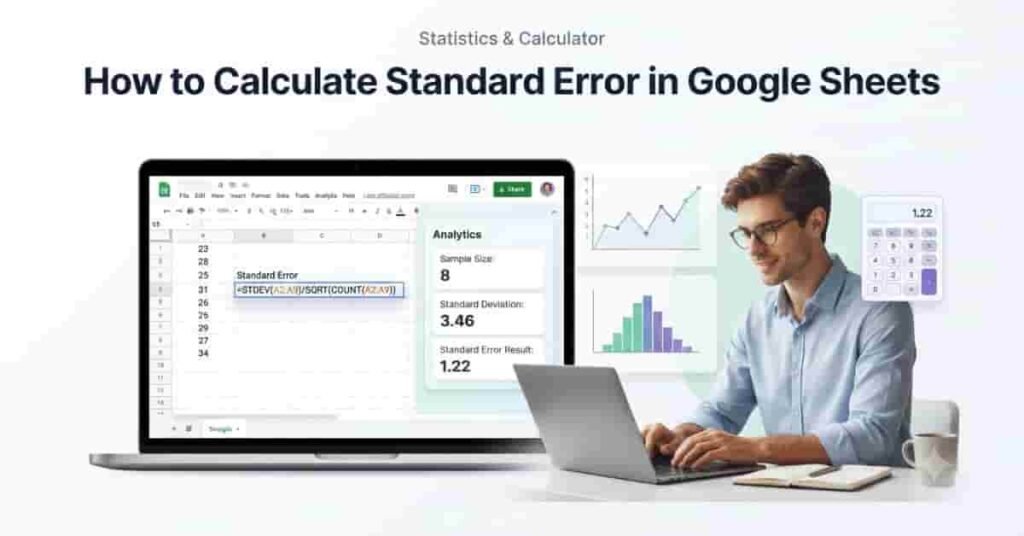
Have you ever wondered how reliable your data really is in Google Sheets? If you’re learning how to calculate standard error in Google Sheets, you’re already taking an important step toward making more accurate data-driven decisions. Whether you’re a student, researcher, or business analyst in the USA, understanding standard error helps you measure how closely your sample represents the larger population. Although Google Sheets doesn’t include a built-in standard error function, you can calculate it quickly using a simple formula. This makes Google Sheets standard error calculation easy, even for beginners with little statistical experience. In this guide, you’ll learn what standard error means, which formula to use, and how to calculate it step by step using real examples. You’ll also discover common mistakes to avoid, tips for improving accuracy, and how to verify your results with confidence. By the end, you’ll be able to perform standard error calculations in Google Sheets quickly and correctly.
If you want to verify your Google Sheets result quickly, you can use our Standard Error Calculator to calculate standard error automatically.
What Is Standard Error in Google Sheets?
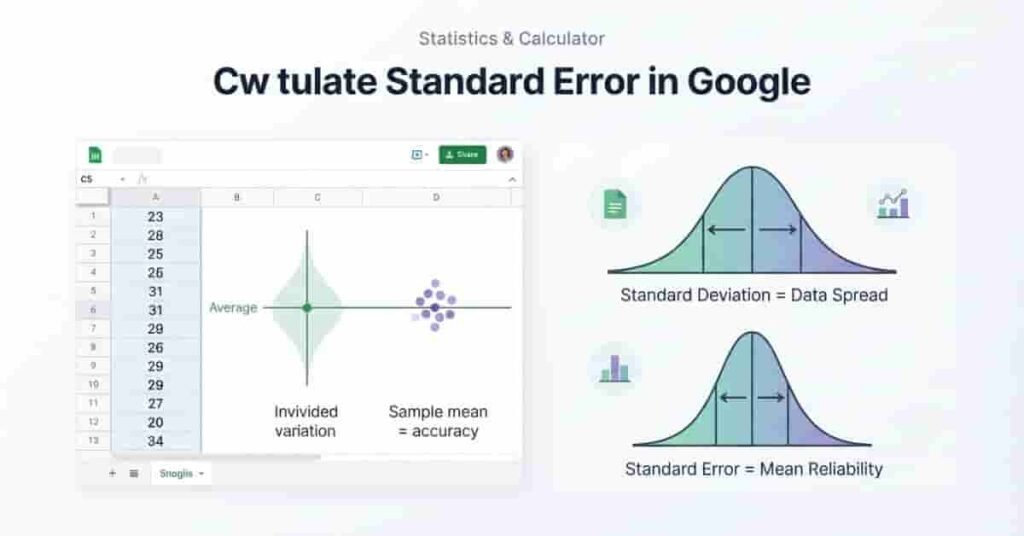
Standard error is a statistical measure that shows how accurately a sample represents an entire population. If you’re learning how to calculate standard error in Google Sheets, understanding this concept is the first step. A smaller standard error means your sample average is likely closer to the true population average. A larger standard error suggests your results may vary more.
If you want to understand the underlying formula before working in Google Sheets, this guide on how to calculate standard error explains the process with simple formulas and examples.
Unlike standard deviation, standard error does not measure how spread out individual data points are. Instead, it measures the precision of the sample mean. Standard deviation describes the variability within your data, while standard error tells you how reliable that average is for making conclusions.
This difference is important when working with survey results, research data, business reports, or classroom assignments. For example, two datasets can have the same standard deviation but different standard errors if their sample sizes are different. As your sample size grows, the standard error usually becomes smaller, making your estimate more reliable.
Google Sheets does not include a built-in standard error function. However, you can calculate it easily using standard spreadsheet functions such as STDEV.S(), COUNT(), and SQRT(). This simple approach makes Google Sheets standard error calculation accessible for beginners and experienced users alike.
Many Google Sheets users calculate standard error to:
- Measure the reliability of a sample mean
- Compare results from different datasets
- Support research and statistical analysis
- Verify calculations before creating reports or presentations
- Check the accuracy of survey or experiment results
Takeaways
- Standard error measures how precisely a sample mean estimates the population mean.
- Standard deviation measures data spread, while standard error measures estimate reliability.
- A larger sample size usually produces a smaller standard error.
- Google Sheets users calculate standard error using spreadsheet formulas instead of a built-in function.
Expert Tip: Before calculating standard error, make sure your dataset contains only valid numeric values. Removing blank cells and text entries helps produce more accurate results.
Need a quick way to check your Google Sheets result? Use our Standard Error Calculator to calculate standard error from the sample standard deviation and sample size.
Data Required Before Calculating Standard Error
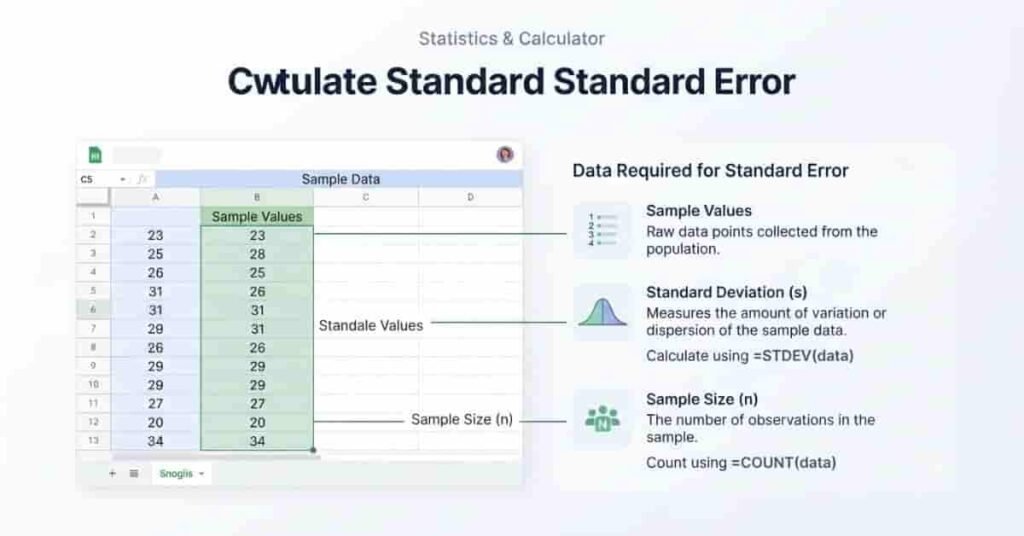
Before you calculate standard error in Google Sheets, gather a few basic pieces of information. Having the correct data ensures your formula returns an accurate result. You don’t need advanced statistical tools, but you do need a clean dataset and the right spreadsheet setup.
Sample Data
Start with a list of numeric values collected from a sample. These values can come from test scores, survey responses, sales figures, or experiment results. Place each value in its own cell within a single column or row. Avoid including text, empty cells, or error values because they can affect your calculations.
If you also work with Microsoft Excel, you can follow this step-by-step guide to calculating standard error in Excel using built-in functions and the Data Analysis ToolPak.
Standard Deviation
Standard deviation measures how much your data values differ from the average. It is one of the key parts of the standard error formula. In Google Sheets, you can calculate it using STDEV.S() for sample data or STDEV.P() if your dataset includes the entire population.
Sample Size
Sample size is the total number of observations in your dataset. Google Sheets uses the COUNT() function to count only numeric cells. A larger sample size generally produces a smaller standard error, making your estimate more reliable.
Spreadsheet Layout Example
A simple spreadsheet layout keeps your calculations organized. For example:
| A |
|---|
| Sample Data |
| 72 |
| 75 |
| 81 |
| 79 |
| 84 |
| 77 |
| 80 |
| 73 |
Once your data is entered, you can calculate the standard deviation, count the observations, and apply the standard error formula in another cell.
Expert Tip: Store your raw data in one column and place formulas in separate cells. This makes your spreadsheet easier to update and reduces the risk of editing mistakes.
Formula to Calculate Standard Error in Google Sheets
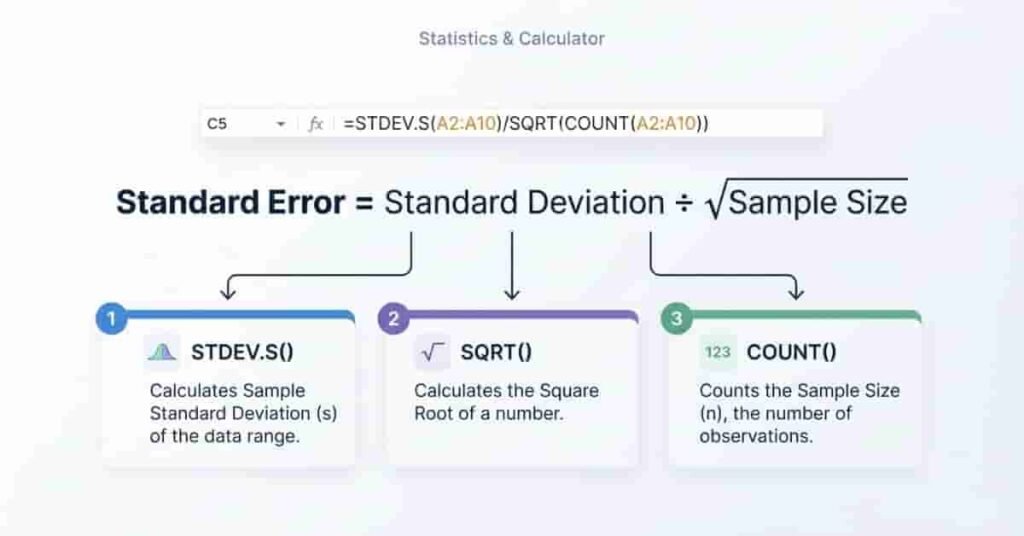
Google Sheets does not provide a built-in standard error function, but you can calculate it using a simple combination of spreadsheet functions. The formula divides the sample standard deviation by the square root of the sample size, giving you the standard error of the mean.
Use this formula:
=STDEV(range)/SQRT(COUNT(range))For newer versions of Google Sheets, the recommended version is:
=STDEV.S(range)/SQRT(COUNT(range))Here’s what each function does:
- STDEV() calculates the sample standard deviation. It is still supported for compatibility but is considered an older function.
- STDEV.S() calculates the sample standard deviation using the current spreadsheet standard. It is the preferred choice when your data represents a sample rather than an entire population.
- COUNT() counts the number of numeric values in the selected range. This gives you the sample size used in the calculation.
- SQRT() returns the square root of the sample size. Dividing the standard deviation by this value produces the standard error.
For example, if your sample data is stored in cells A2:A11, use:
=STDEV.S(A2:A11)/SQRT(COUNT(A2:A11))This formula updates automatically whenever you add or remove numeric values from the selected range, making it useful for dynamic datasets.
Takeaways
- Use STDEV.S() for most classroom, research, and business datasets.
- Use COUNT() to calculate the sample size automatically.
- SQRT() computes the square root required by the standard error formula.
- The complete formula updates automatically as your dataset changes.
Expert Tip: Use cell ranges instead of typing values directly into the formula. This keeps your calculations dynamic and reduces manual errors when your data changes.
How to Calculate Standard Error in Google Sheets (Step-by-Step)
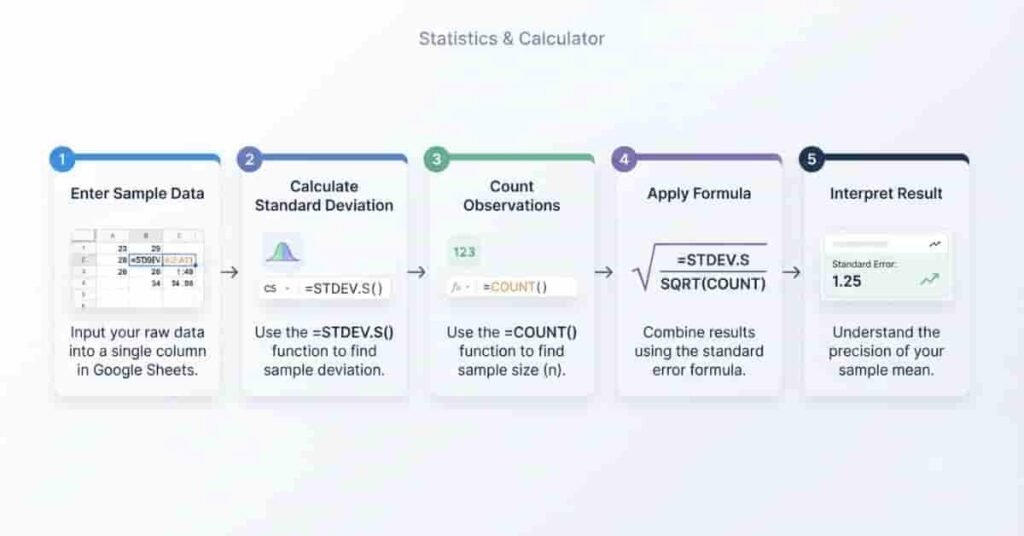
Calculating standard error in Google Sheets is simple once your data is organized. You only need your sample values and a few built-in spreadsheet functions. Follow these five steps to calculate the standard error accurately.
After calculating standard error in Google Sheets, you can use our Standard Error Calculator to verify your result.
Step 1 — Enter Your Sample Data
Begin by entering your sample data into a single column or row. Each value should be in its own cell with no blank rows between entries. For example, you might enter test scores in cells A2:A11.
Before moving on, check that every cell contains a numeric value. Remove text, symbols, or empty cells that could affect the calculation.
Pro Tip: Keep your raw data separate from your formulas. This makes your spreadsheet easier to read and update.
Step 2 — Calculate the Standard Deviation
Next, calculate the sample standard deviation. Click an empty cell and enter the following formula:
=STDEV.S(A2:A11)Replace A2:A11 with your actual data range if it is different.
Google Sheets will return the sample standard deviation, which measures how much your data varies from the average. This value is required for calculating the standard error.
Pro Tip: Use STDEV.S() for sample data. Only use STDEV.P() when your dataset represents the entire population.
Step 3 — Count the Number of Observations
Now determine the sample size by counting the numeric values in your dataset. In another empty cell, enter:
=COUNT(A2:A11)The COUNT() function ignores blank cells and text entries. It counts only numeric values, giving you the correct sample size for the calculation.
A larger sample size generally leads to a smaller standard error because the estimate becomes more precise.
Pro Tip: Double-check that your selected range includes every data point and excludes headers.
Step 4 — Apply the Standard Error Formula
With the standard deviation and sample size ready, calculate the standard error using this formula:
=STDEV.S(A2:A11)/SQRT(COUNT(A2:A11))Press Enter, and Google Sheets will display the standard error for your dataset. If you add or remove values within the selected range, the result updates automatically.
Pro Tip: Use cell ranges instead of typing numbers directly into the formula. Dynamic formulas save time and reduce manual mistakes.
Step 5 — Interpret the Result
The final value tells you how accurately your sample mean represents the population mean. A smaller standard error indicates a more reliable estimate because the sample mean is likely closer to the true population mean.
A larger standard error suggests greater uncertainty. This can happen when the sample size is small or the data has high variability. If your result seems unusually high, review your dataset for missing values, incorrect ranges, or outliers before drawing conclusions.
Expert Tip: After calculating the standard error, compare it with your sample mean and standard deviation. Looking at all three values together provides a clearer picture of your dataset’s reliability.
Once you understand standard error, you can also learn how to calculate standard error from a confidence interval when you already have confidence interval values available.
Worked Example in Google Sheets
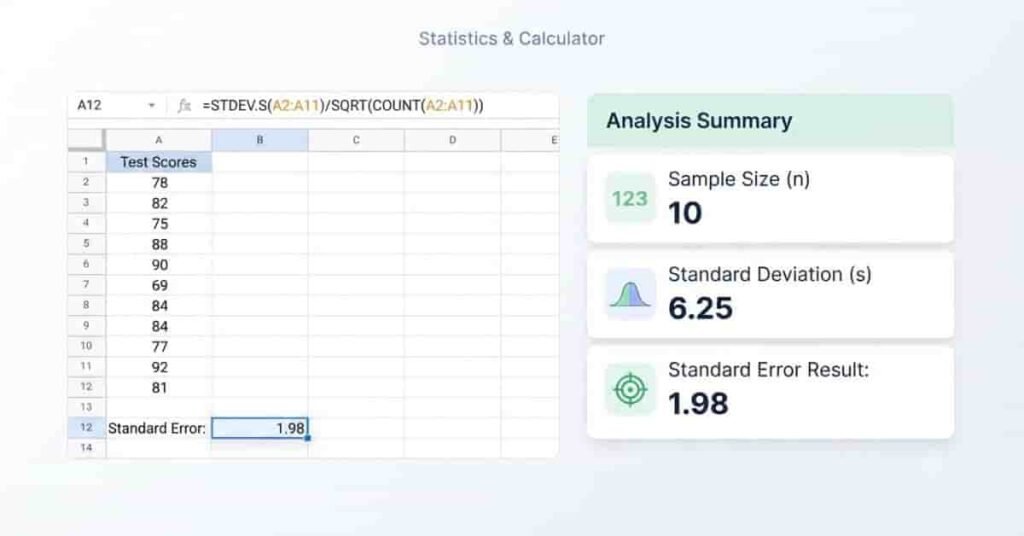
Let’s walk through a simple example to see how standard error is calculated in Google Sheets. This example uses a small dataset, but the same process works for larger spreadsheets.
Sample Dataset
Enter the following values into cells A2:A9:
| Cell | Value |
|---|---|
| A2 | 72 |
| A3 | 75 |
| A4 | 81 |
| A5 | 79 |
| A6 | 84 |
| A7 | 77 |
| A8 | 80 |
| A9 | 73 |
Next, enter the standard error formula into an empty cell:
=STDEV.S(A2:A9)/SQRT(COUNT(A2:A9))Google Sheets calculates the sample standard deviation, counts the number of observations, and divides the standard deviation by the square root of the sample size. The formula returns a standard error of approximately 1.44 for this dataset.
A standard error of 1.44 means the sample mean is expected to vary by about 1.44 units from the true population mean. A smaller value would indicate a more precise estimate.
Common Errors in Google Sheets
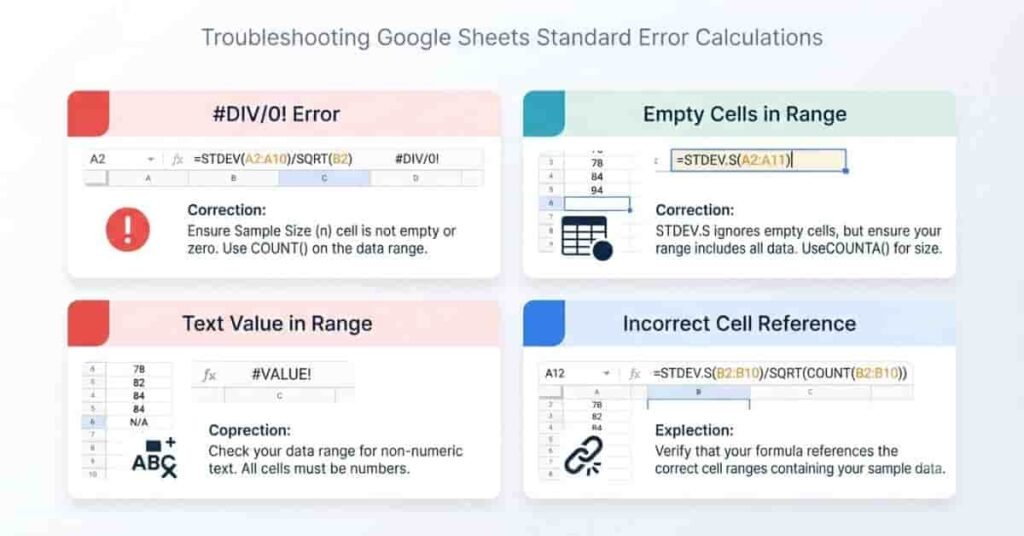
Even though the standard error formula is straightforward, small mistakes can lead to incorrect results or spreadsheet errors. Checking your data and formulas before calculating can save time and improve accuracy.
#DIV/0! Error
This error usually appears when COUNT() returns zero. It happens if your selected range contains no numeric values or is completely empty.
Solution: Make sure your data range includes at least two numeric values before applying the formula.
Empty Cells
Blank cells inside your dataset may not always cause an error, but they can reduce the sample size and affect your calculation.
Solution: Review your dataset and remove unnecessary blank rows or update your selected range.
Text Values in Numeric Ranges
If cells contain text instead of numbers, Google Sheets ignores them when using COUNT(). This can produce an incorrect sample size.
Solution: Ensure every value used in the calculation is numeric.
Wrong Function Selection
Using STDEV.P() instead of STDEV.S() changes the calculation. Most users work with sample data, so STDEV.S() is usually the correct choice.
Solution: Choose the function that matches your dataset. Use STDEV.S() for samples and STDEV.P() only for complete populations.
Incorrect Cell References
Selecting the wrong range is a common mistake. Missing values or including headers can change the final result.
Solution: Double-check your cell references before pressing Enter.
Tips for Accurate Standard Error Calculations
A correct formula is only part of an accurate calculation. Clean data and proper spreadsheet practices help you produce reliable results every time.
Start by using STDEV.S() whenever your dataset is a sample. This is the recommended function for most classroom assignments, surveys, and research projects. If your data represents the entire population, use STDEV.P() instead.
Always verify that your selected range includes every data point and excludes headers or unrelated cells. Even one missing value can change the standard error.
Remove blank cells, text entries, and duplicate values whenever possible. Clean data reduces errors and improves the reliability of your analysis.
Keep your formulas dynamic by referencing cell ranges instead of typing numbers directly into the formula. This allows Google Sheets to update the result automatically whenever your dataset changes.
Finally, double-check your sample size. Since the standard error depends on the number of observations, an incorrect count can produce misleading results.
Takeaways
- Use STDEV.S() for sample data.
- Verify your data range before calculating.
- Remove blank cells and non-numeric values.
- Use dynamic formulas that update automatically.
- Confirm your sample size is correct.
Expert Tip: Before sharing your results, compare your spreadsheet output with a trusted Standard Error Calculator. A quick cross-check helps catch formula or data entry mistakes.
Google Sheets vs Excel for Standard Error Calculations

Both Google Sheets and Microsoft Excel can calculate standard error using the same statistical formulas. The main difference is not the calculation itself but how you work with your spreadsheets. If you already use Google Workspace, Google Sheets offers a simple way to calculate standard error from any device. Excel, on the other hand, provides more advanced data analysis features for large or complex projects.
The formula for calculating standard error is the same in both applications, so you can expect identical results when using the same dataset and functions.
| Feature | Google Sheets | Excel |
|---|---|---|
| Built-in Statistical Functions | ✔ | ✔ |
| Cloud-Based | ✔ | ✖ (Desktop) |
| Collaboration | ✔ | Limited |
| Formula Accuracy | Same | Same |
| Ease of Sharing | Better | Good |
When Should You Use Google Sheets?
Google Sheets is a great choice if you:
- Work online from multiple devices
- Collaborate with classmates or coworkers
- Need automatic cloud saving
- Share spreadsheets using a simple link
- Want a free spreadsheet solution
When Should You Use Excel?
Excel is a better option if you:
- Analyze very large datasets
- Use advanced statistical tools or add-ins
- Create complex reports and dashboards
- Work primarily offline
- Need enterprise-level spreadsheet features
For most students, researchers, and small business users, Google Sheets provides everything needed to calculate standard error accurately. If your work involves advanced statistical modeling or large datasets, Excel may offer additional capabilities.
If you prefer a faster way to calculate standard error, try our Standard Error Calculator after completing the steps in Google Sheets.
Use Our Free Standard Error Calculator
While Google Sheets makes it easy to calculate standard error, entering formulas manually can still take time. If you want a faster and simpler option, try our Free Standard Error Calculator.
Instead of building formulas yourself, simply enter your data and let the calculator do the work. It calculates the standard error instantly and shows each step, making it easy to understand how the result is produced. This is especially helpful for students, researchers, and anyone who wants to check their spreadsheet calculations.
Our calculator is also a great way to verify the results from Google Sheets. If your spreadsheet returns an unexpected value, you can compare it with the calculator to identify possible formula or data entry errors.
Why Use Our Calculator?
- Instant standard error calculations
- No spreadsheet formulas required
- Step-by-step calculation breakdown
- Easy for beginners and advanced users
- Perfect for verifying Google Sheets results
- Works on desktop, tablet, and mobile devices
Conclusion
Learning how to calculate standard error in Google Sheets is easier than it may seem. With the right formula and a well-organized dataset, you can measure how reliable your sample mean is in just a few steps. You also learned the difference between standard deviation and standard error, how to avoid common spreadsheet mistakes, and when to use STDEV.S() for the most accurate Google Sheets standard error calculation.
If you want to save time or double-check your results, try our free Standard Error Calculator for instant, step-by-step calculations. If you found this guide helpful, share it with classmates or colleagues who use Google Sheets for data analysis. You can also explore our other statistics guides and calculators to build your confidence with spreadsheet calculations.
Frequently Asked Questions
Find quick answers to the most common questions about calculating standard error in Google Sheets.
Use the following formula:
=STDEV.S(range)/SQRT(COUNT(range))
Replace range with your actual data range, such as A2:A11. The formula divides the sample standard deviation by the square root of the sample size to calculate the standard error.
No. Google Sheets does not include a built-in standard error function. Instead, calculate it using a combination of STDEV.S(), COUNT(), and SQRT().
For most datasets, use:
=STDEV.S(range)/SQRT(COUNT(range))
This is the recommended formula for calculating the standard error from sample data.
Use STDEV.S() when working with sample data. It is the modern and recommended function in Google Sheets. The older STDEV() function is kept mainly for compatibility with older spreadsheets.
This error usually occurs because your selected range contains no numeric values or the sample size is zero. Make sure your dataset includes at least two numeric observations.
Yes. After entering the formula, Google Sheets automatically updates the standard error whenever you edit, add, or remove values from the selected range.
Yes. Google Sheets and Microsoft Excel use the same statistical formula for standard error. Using the same data and formula will produce the same result in both applications.
Yes. Simply enter your raw numeric data into Google Sheets and apply the STDEV.S(), COUNT(), and SQRT() functions to calculate the standard error.
Standard deviation measures how spread out your data values are. Standard error measures how accurately the sample mean represents the population mean. Both are useful, but they answer different statistical questions.
Yes. An online Standard Error Calculator lets you verify your Google Sheets result instantly. Enter the same dataset into the calculator and compare the output to confirm your spreadsheet calculation.

We are the StatisticsTools.com Development Team, dedicated to building accurate, easy-to-use statistical calculators and educational resources for students, educators, researchers, and professionals.
Our mission is to make statistics simple by providing free, reliable tools for data analysis, probability, hypothesis testing, regression, and other statistical calculations. We also create practical guides that explain statistical concepts in a clear and easy-to-understand way.
At StatisticsTools.com, we are continuously improving our platform by adding new calculators and educational resources to help users solve statistical problems quickly and confidently.