
Introduction
Ever wondered how researchers know whether a sample mean truly represents a larger population?
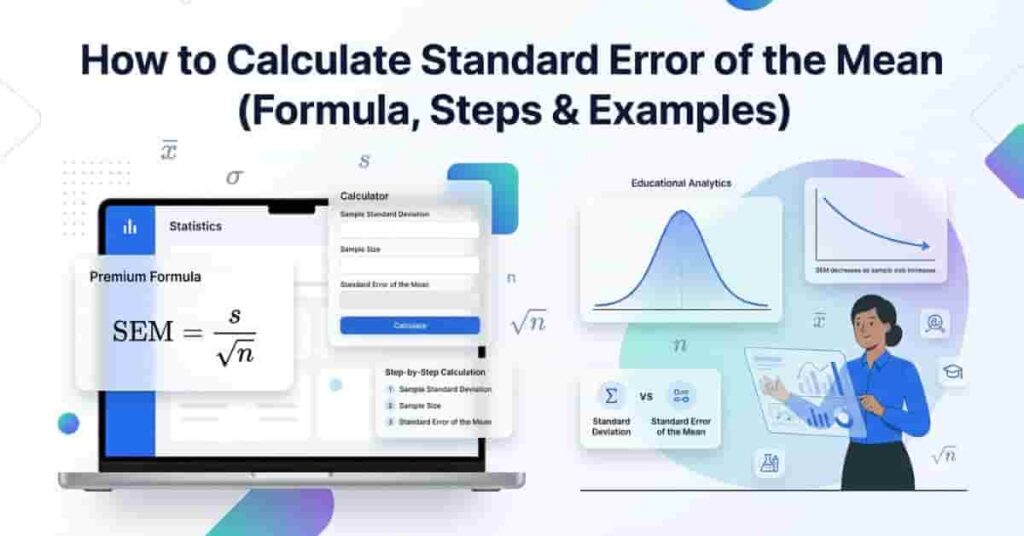
If you’re learning how to calculate standard error of the mean, you’re building an essential statistics skill used in research, education, healthcare, business, and data analysis. The Standard Error of the Mean (SEM) measures how precisely a sample mean estimates the true population mean. Calculating it correctly helps you evaluate the reliability of your results and make better data-driven decisions. Whether you’re a student, researcher, or professional in the USA, understanding SEM is an important step toward interpreting statistical findings with confidence.
In this guide, you’ll learn the SEM formula, how to calculate it step by step, and how to interpret your results correctly. We’ll also explain common mistakes to avoid, show a worked example, and discuss how sample size affects SEM. If you’ve ever asked, how do you calculate the standard error of the mean, this beginner-friendly guide will give you the knowledge and confidence to solve SEM calculations accurately.
Need a faster way to calculate the Standard Error of the Mean? Try our free Standard Error of the Mean Calculator to get instant results with step-by-step calculations—no manual formulas required.
What Is the Standard Error of the Mean?
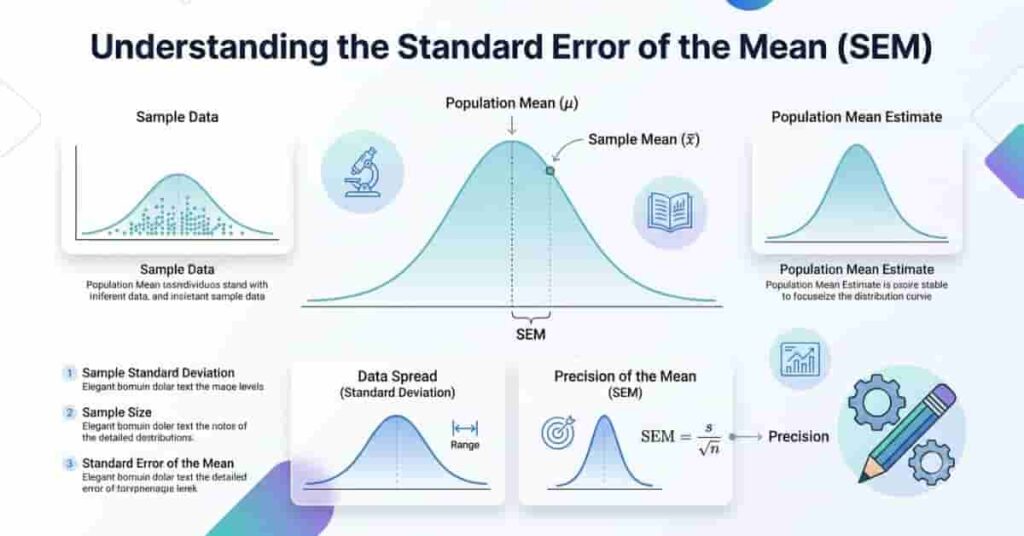
The Standard Error of the Mean (SEM) measures how accurately a sample mean represents the true population mean. Instead of showing how spread out individual data values are, SEM shows the precision of the sample mean. A smaller SEM means your sample mean is more likely to be close to the actual population mean.
SEM is calculated using the sample standard deviation and the sample size. As the sample size increases, the SEM becomes smaller because larger samples usually provide more reliable estimates. This is why researchers often collect enough data before drawing conclusions from a study.
The main purpose of SEM is to help evaluate the reliability of statistical results. It plays an important role in hypothesis testing, confidence intervals, and many other statistical methods. Researchers use it to understand how much the sample mean might change if the study were repeated with different samples from the same population.
It’s important to understand the relationship between the sample mean and SEM. The sample mean estimates the average value of a population, while SEM measures the uncertainty of that estimate. Two studies may have the same sample mean but different SEM values because of differences in sample size or variability.
Researchers report SEM because it helps readers judge the precision of their findings. A lower SEM suggests that the estimated mean is more dependable, while a higher SEM indicates greater uncertainty.
Key Takeaways
- SEM measures the precision of the sample mean.
- It is different from the standard deviation, which measures data variability.
- Larger sample sizes usually produce a smaller SEM.
- Researchers use SEM to assess the reliability of sample-based estimates.
- SEM is commonly used when reporting research findings and calculating confidence intervals.
💡 Pro Tip: Don’t confuse the Standard Error of the Mean with the Standard Deviation. SEM measures the precision of the sample mean, while Standard Deviation measures the spread of individual observations.
When Should You Calculate the Standard Error of the Mean?

You should calculate the Standard Error of the Mean (SEM) whenever you want to know how accurately a sample mean estimates the true population mean. It is especially useful when working with sample data and making conclusions about a larger population. SEM helps determine whether your estimate is precise enough to support reliable decisions.
In scientific research, SEM is used to report the precision of experimental results. Researchers often include SEM in tables and graphs to show how closely the sample mean is expected to reflect the population mean.
In medical studies, SEM helps evaluate measurements such as blood pressure, cholesterol levels, or treatment outcomes. A smaller SEM gives healthcare professionals greater confidence in the reported average values.
In psychology, SEM is commonly used when analyzing test scores, behavioral studies, and survey responses. It helps researchers understand how much the average result may vary from the true population average.
In education, teachers and education researchers use SEM to analyze exam scores, classroom assessments, and standardized tests. It provides a clearer picture of how accurately the average score represents student performance.
SEM is also valuable in survey research. Polling organizations use it to estimate how well survey results represent the opinions of a larger population. Lower SEM values generally indicate more precise survey estimates.
In business analytics, companies use SEM to evaluate customer satisfaction, product performance, employee engagement, and marketing campaigns. It helps decision-makers determine whether average results are stable enough to guide business strategies.
💡 Pro Tip: If your goal is to describe how spread out the data are, use the Standard Deviation. If your goal is to measure the precision of the sample mean, use the Standard Error of the Mean.
Formula for the Standard Error of the Mean
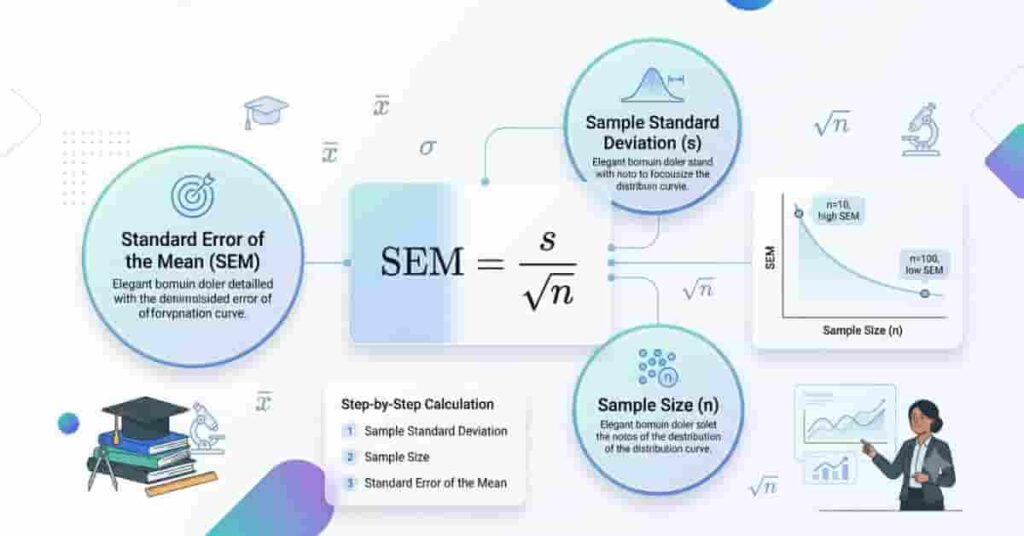
The Standard Error of the Mean (SEM) is calculated using the sample standard deviation and the sample size. This formula shows how precisely a sample mean estimates the true population mean. As your sample size grows, the SEM usually becomes smaller, making your estimate more reliable.
Finished the manual calculation? Double-check your answer with our Standard Error of the Mean Calculator. It provides accurate results, detailed steps, and supports both raw datasets and summary statistics.
Standard Error of the Mean Formula
Standard Error of the Mean Formula
Where:
| Symbol | Meaning |
|---|---|
| SEM | Standard Error of the Mean |
| s | Sample standard deviation |
| n | Sample size (number of observations) |
| √n | Square root of the sample size |
The sample standard deviation (s) measures how much individual values vary from the sample mean. If your data are widely spread out, the standard deviation will be larger, resulting in a larger SEM.
The sample size (n) is the total number of observations in your sample. Larger samples generally produce more stable estimates because they better represent the population.
You might wonder why the formula uses the square root of the sample size instead of the sample size itself. The reason is that sampling variability decreases more slowly than the number of observations increases. Dividing by √n reflects this relationship and shows how precision improves as more data are collected. For example, doubling your sample size does not cut the SEM in half. Instead, the reduction depends on the square root of the increase in sample size.
This formula is widely used in statistics, research, and data analysis because it provides a simple way to measure the reliability of a sample mean.
Key Takeaways
- SEM = s / √n is the standard formula for calculating the Standard Error of the Mean.
- s measures the spread of the sample data.
- n is the total number of observations.
- Increasing the sample size usually decreases the SEM.
- A smaller SEM indicates a more precise estimate of the population mean.
💡 Pro Tip: Always use the sample standard deviation (s) when calculating SEM from sample data. Using the population standard deviation may produce incorrect results unless the entire population is known.
How to Calculate the Standard Error of the Mean (Step-by-Step)
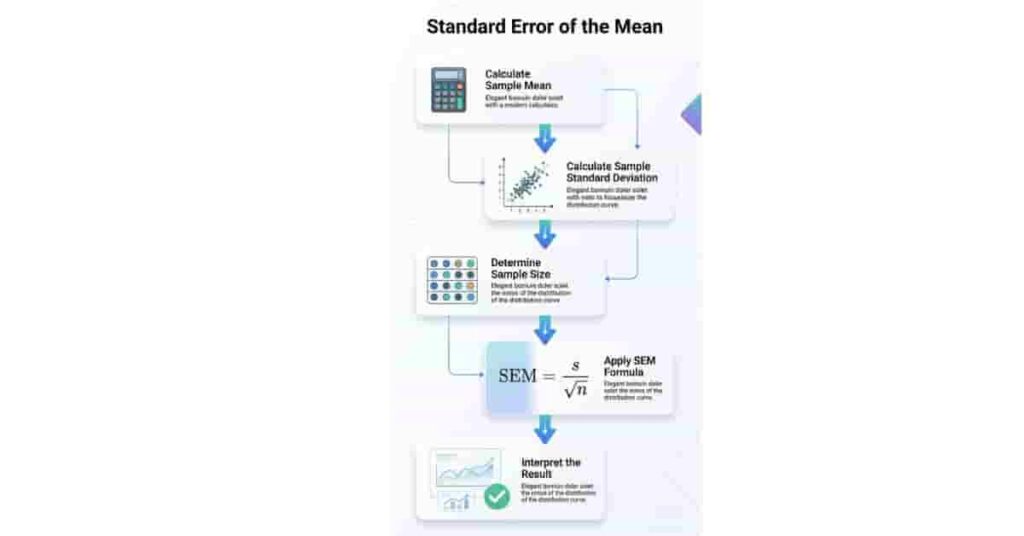
Calculating the Standard Error of the Mean (SEM) is straightforward once you know the required values. You need the sample mean, the sample standard deviation, and the sample size. Follow the five simple steps below to calculate SEM accurately.
Step 1 — Calculate the Sample Mean
Start by finding the sample mean, which represents the average of all observations in your dataset. Add every value together and divide the total by the number of observations.
Formula
Mean = Sum of all observations ÷ Number of observations
The sample mean serves as the foundation for calculating the sample standard deviation in the next step.
💡 Pro Tip: Double-check your calculations before moving forward. An incorrect mean affects every step that follows.
Step 2 — Calculate the Sample Standard Deviation
Next, calculate the sample standard deviation (s). This value measures how much the observations vary around the sample mean.
To calculate it:
- Subtract the mean from each observation.
- Square each difference.
- Add the squared differences.
- Divide by n − 1.
- Take the square root.
Most statistical software, spreadsheets, and online calculators can compute the sample standard deviation automatically.
💡 Pro Tip: Use the sample standard deviation formula with n − 1, not n, when working with sample data.
Step 3 — Determine the Sample Size
Count the total number of observations in your dataset. This number is your sample size (n).
For example, if your dataset contains 30 values, then:
n = 30
A larger sample size generally reduces the Standard Error of the Mean because larger samples provide more stable estimates of the population mean.
💡 Pro Tip: Count every valid observation only once. Missing or duplicate values can change your SEM.
Step 4 — Apply the SEM Formula
After finding the sample standard deviation and sample size, substitute both values into the SEM formula.
SEM = s / √n
Example
- Sample standard deviation (s) = 8
- Sample size (n) = 64
SEM = 8 ÷ √64
SEM = 8 ÷ 8 = 1
The calculated Standard Error of the Mean is 1.
💡 Pro Tip: Always calculate the square root of the sample size before dividing the standard deviation.
Step 5 — Interpret the Result
The final SEM tells you how precisely the sample mean estimates the true population mean.
- A smaller SEM means the sample mean is likely to be very close to the population mean.
- A larger SEM suggests more uncertainty in the estimate.
- Increasing the sample size usually lowers the SEM and improves precision.
Remember that SEM does not measure the spread of individual observations. It measures the reliability of the sample mean.
💡 Pro Tip: Compare SEM values only when the measurements use the same units and represent similar datasets.
Now that you know how to calculate the Standard Error of the Mean, put your knowledge into practice with our free Standard Error of the Mean Calculator. Simply enter your values or paste your dataset to get instant, accurate results with a complete step-by-step solution.
Worked Example
Let’s calculate the Standard Error of the Mean (SEM) using a simple dataset. This example shows each step, making it easier to understand how the formula works in practice.
Sample Dataset
12, 15, 14, 13, 16, 15, 17, 14
From this dataset:
Interpretation
An SEM of 0.57 means the sample mean is expected to vary by about 0.57 units from the true population mean because of random sampling. Since the SEM is relatively small, the sample mean provides a fairly precise estimate of the population mean.
Keep in mind that SEM reflects the precision of the sample mean, not the spread of the individual observations. If this study were repeated with many similar samples, the sample means would typically vary by about 0.57 units around the true population mean.
Key Takeaways
- Start with the sample mean, standard deviation, and sample size.
- Apply the formula SEM = s / √n.
- A smaller SEM indicates a more precise estimate.
- SEM measures the reliability of the sample mean, not the variability of the dataset.
💡 Pro Tip: If you don’t want to perform manual calculations, use an online Standard Error of the Mean Calculator to verify your answer instantly.
How Sample Size Affects the Standard Error of the Mean
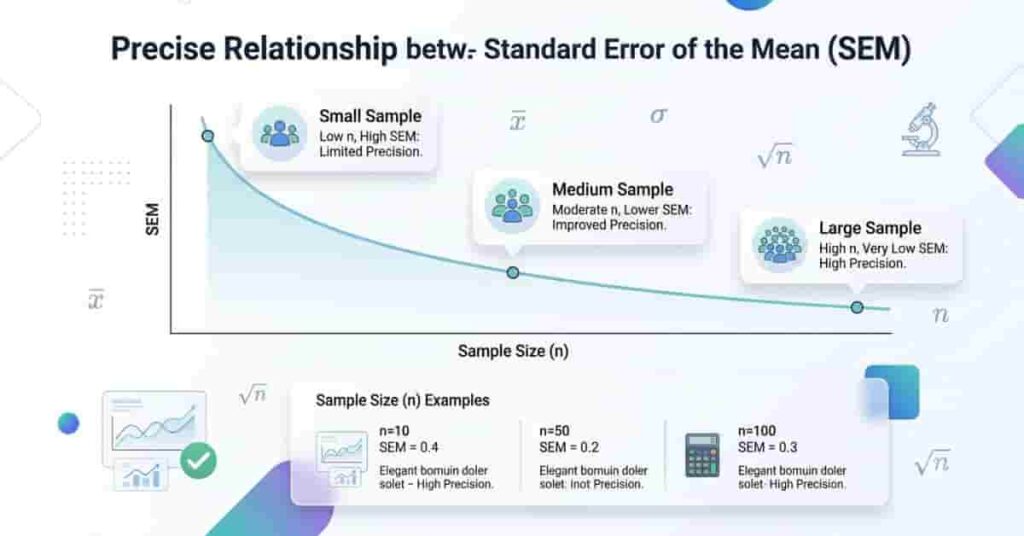
Sample size has a direct impact on the Standard Error of the Mean (SEM). When the sample size increases, the SEM usually decreases. This means larger samples provide more precise estimates of the population mean than smaller samples.
With a small sample, each observation has a greater influence on the average. As a result, the sample mean can change more from one sample to another, leading to a larger SEM. This increased variability makes the estimate less precise.
A large sample better represents the population because it includes more information. Individual observations have less influence on the overall average, so the sample mean becomes more stable. This reduces the SEM and increases confidence in the estimate.
The SEM decreases because the formula divides the standard deviation by the square root of the sample size (√n). Although adding more observations improves precision, the improvement becomes smaller as the sample continues to grow. This means doubling the sample size does not cut the SEM in half.
Example Comparison
Assume the sample standard deviation remains 12.
How to Interpret the Standard Error of the Mean
Calculating the Standard Error of the Mean (SEM) is only the first step. The next step is understanding what the result tells you about the reliability of your sample mean. In general, a smaller SEM indicates a more precise estimate, while a larger SEM suggests greater uncertainty.
A low SEM means the sample mean is likely to be close to the true population mean. This usually happens when the sample size is large, the data show less variability, or both. Researchers often consider a lower SEM a sign that the reported average is more dependable.
A high SEM indicates that the sample mean may vary more from the true population mean. This can happen when the sample size is small or when the data have high variability. In these situations, the estimated mean should be interpreted with greater caution.
Remember that SEM measures the precision of the sample mean, not the spread of individual data points. Two datasets can have the same mean but different SEM values because of differences in sample size or variability.
Interpretation Guide
| SEM Result | What It Means |
|---|---|
| Low SEM | High precision and greater confidence in the sample mean. |
| Moderate SEM | Reasonably precise estimate with some sampling uncertainty. |
| High SEM | Lower precision and greater uncertainty in the sample mean. |
When reviewing research papers, don’t judge SEM by its value alone. Always consider the sample size, standard deviation, and the context of the study before drawing conclusions.
Common Mistakes When Calculating the Standard Error of the Mean
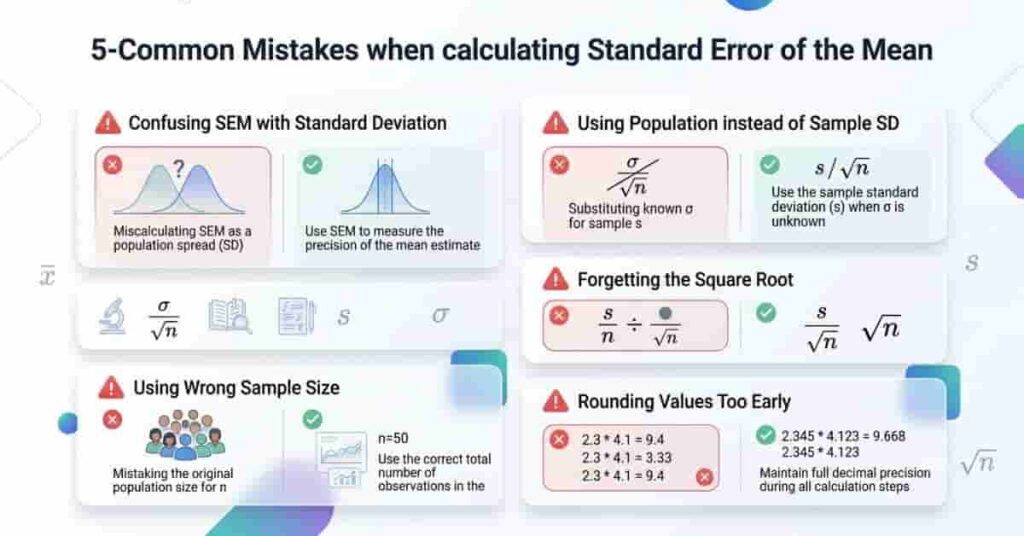
The Standard Error of the Mean (SEM) is easy to calculate once you know the formula, but small mistakes can lead to incorrect results. Understanding these common errors will help you calculate SEM more accurately and interpret your findings with confidence.
One of the most common mistakes is confusing SEM with Standard Deviation (SD). Although both use the same data, they measure different things. Standard Deviation describes how spread out individual observations are, while SEM measures how precisely the sample mean estimates the population mean.
Another frequent error is using the population standard deviation instead of the sample standard deviation. The SEM formula typically uses the sample standard deviation (s) because most studies analyze sample data rather than an entire population.
Many beginners also forget to calculate the square root of the sample size. The correct formula is SEM = s / √n, not s / n. Skipping the square root makes the SEM much smaller than it should be.
Using the wrong sample size is another issue. Count only valid observations included in your analysis. Missing values, duplicate records, or incorrect counts will affect the final result.
Finally, avoid rounding numbers too early. Keep several decimal places during intermediate calculations and round only the final SEM. This helps maintain accuracy, especially when working with small datasets.
Key Takeaways
- Don’t confuse SEM with Standard Deviation.
- Use the sample standard deviation (s) for sample data.
- Always divide by √n, not n.
- Verify your sample size before calculating.
- Round only the final answer to reduce calculation errors.
💡 Pro Tip: If you’re unsure about your calculations, check them with an online Standard Error of the Mean Calculator before reporting your results.
Standard Error of the Mean vs Standard Deviation
The Standard Error of the Mean (SEM) and Standard Deviation (SD) are closely related, but they serve different purposes. Because both involve variability, beginners often confuse them. Understanding the difference is essential for choosing the correct statistical measure.
Standard Deviation describes how much individual observations vary around the sample mean. In contrast, SEM measures how accurately the sample mean estimates the true population mean. While Standard Deviation focuses on the spread of the data, SEM focuses on the precision of the average.
Researchers often report both values because they answer different questions. SD helps readers understand the variability within a dataset, while SEM shows the reliability of the reported mean.
Comparison Table
| Feature | Standard Error of the Mean (SEM) | Standard Deviation (SD) |
|---|---|---|
| Definition | Measures the precision of the sample mean. | Measures the spread of individual observations. |
| Formula | SEM = s / √n | Calculated from deviations around the sample mean. |
| Purpose | Estimates how closely the sample mean represents the population mean. | Describes the variability within a dataset. |
| Interpretation | Smaller SEM indicates a more precise estimate. | Larger SD indicates greater variation among data values. |
| Typical Use | Research reports, confidence intervals, and hypothesis testing. | Descriptive statistics and data analysis. |
Although SEM is calculated using Standard Deviation, the two values should never be used interchangeably. Before choosing one, ask yourself whether you want to measure data variability or estimate precision.
💡 Pro Tip: If you’re describing the variability of a dataset, report Standard Deviation. If you’re reporting the precision of the sample mean, use Standard Error of the Mean.
Can You Calculate the Standard Error of the Mean Without Standard Deviation?
The short answer is no. The Standard Error of the Mean (SEM) cannot be calculated directly without a measure of variability. The standard SEM formula requires the sample standard deviation (s) because it measures how much the observations vary around the sample mean.
If you have raw data, you can still calculate SEM even if the standard deviation is not provided. First, calculate the sample mean. Next, compute the sample standard deviation from the dataset. Once you have both the standard deviation and the sample size, apply the formula:
SEM = s / √n
If you only have summary statistics, you can calculate SEM as long as the sample standard deviation and sample size are reported. Many research papers include these values, making it easy to calculate SEM without access to the original dataset.
However, if neither the raw data nor the sample standard deviation is available, you cannot accurately calculate the Standard Error of the Mean. The standard deviation is an essential part of the formula because it reflects the variability within the sample.
When the required information is missing, your practical options are to request the original dataset, locate the reported standard deviation, or use published summary statistics from the study. Without these values, any SEM estimate would be unreliable.
Use Our Free Standard Error of the Mean Calculator
Calculating the Standard Error of the Mean (SEM) by hand can be time-consuming, especially when working with large datasets or multiple calculations. Our Standard Error of the Mean Calculator makes the process fast, accurate, and beginner-friendly.
Simply enter your sample standard deviation and sample size, or paste your raw dataset. The calculator instantly computes the SEM and provides a clear, step-by-step solution so you can understand every stage of the calculation. Whether you’re a student, researcher, educator, or data analyst, you can verify your results in seconds without performing manual calculations.
Why Use Our SEM Calculator?
- ⚡ Get instant Standard Error of the Mean calculations
- ✅ View a step-by-step solution for every calculation
- 🎯 Receive accurate and reliable results
- 📊 Enter either summary statistics or a raw dataset
- 🚫 No manual formulas or complex calculations required
- 💻 Free to use on desktop, tablet, and mobile devices
📊 Ready to Calculate Your SEM?
Calculate the Standard Error of the Mean (SEM) instantly using our free calculator. Simply enter your sample standard deviation and sample size to get fast, accurate results with step-by-step calculations.
🚀 Use the Free SEM CalculatorConclusion
Understanding how to calculate standard error of the mean is an essential skill for interpreting sample data with confidence. You learned what the Standard Error of the Mean (SEM) is, how to use the SEM formula, how sample size affects the result, and how to avoid common calculation mistakes. With these concepts, you can better evaluate the precision of a sample mean and make more informed statistical decisions.
If you want to save time and eliminate manual calculations, try our free Standard Error of the Mean Calculator for instant, accurate results with step-by-step solutions. If you found this guide helpful, consider sharing it with classmates or colleagues, and explore our other statistics calculators and guides to continue building your statistical knowledge.
Frequently Asked Questions
Find quick answers to the most common questions about the Standard Error of the Mean (SEM), its formula, calculation, interpretation, and practical use.
What is the standard error of the mean?
The Standard Error of the Mean (SEM) measures how accurately a sample mean estimates the true population mean. A smaller SEM indicates that the sample mean is likely to be closer to the actual population mean.
How do you calculate the standard error of the mean?
Divide the sample standard deviation by the square root of the sample size.
You only need the sample standard deviation (s) and the sample size (n).
What is the SEM formula?
The standard formula is:
Where s is the sample standard deviation and n is the sample size.
Why do we divide by the square root of the sample size?
Using the square root of the sample size reflects how sampling variability decreases as more observations are collected. Larger samples provide more precise estimates, resulting in a smaller Standard Error of the Mean.
What does a low SEM indicate?
A low SEM means the sample mean is a more precise estimate of the population mean. It generally indicates higher confidence in the reported average.
Is SEM the same as standard deviation?
No. Standard Deviation measures the spread of individual data values, while the Standard Error of the Mean measures the precision of the sample mean.
Can I calculate SEM from raw data?
Yes. Calculate the sample mean, then the sample standard deviation, count the sample size, and finally apply the SEM formula. You can also use an online calculator to perform these steps automatically.
Why does SEM decrease as sample size increases?
As the sample size grows, the sample mean becomes a more reliable estimate of the population mean. This reduces sampling error and lowers the Standard Error of the Mean.
Can I calculate SEM in Excel?
Yes. Use the STDEV.S() function to calculate the sample standard deviation and divide it by SQRT(n). An online SEM calculator can simplify the process even further.
Can I use an online SEM calculator?
Absolutely. An online Standard Error of the Mean Calculator provides instant, accurate results, step-by-step calculations, and eliminates the need for manual computation.

We are the StatisticsTools.com Development Team, dedicated to building accurate, easy-to-use statistical calculators and educational resources for students, educators, researchers, and professionals.
Our mission is to make statistics simple by providing free, reliable tools for data analysis, probability, hypothesis testing, regression, and other statistical calculations. We also create practical guides that explain statistical concepts in a clear and easy-to-understand way.
At StatisticsTools.com, we are continuously improving our platform by adding new calculators and educational resources to help users solve statistical problems quickly and confidently.