
Table of Contents
Introduction
Have you ever had a set of numbers and wondered how spread out they really are?
Mean Absolute Deviation (MAD) gives you a simple way to measure that spread. If you are learning statistics, understanding MAD can make data analysis much easier.
Knowing how to calculate mean absolute deviation is useful for homework, classwork, and statistics exams. The calculation looks complex at first, but it follows a few clear steps.
In this guide, you will learn what Mean Absolute Deviation means and how its formula works. You will also see a complete example with simple numbers.
We will calculate the mean, find each absolute deviation, add the deviations, and divide by the number of values. You will also learn how to interpret the final MAD.
By the end, you should be able to calculate MAD confidently from a data set. You can also use our Mean Absolute Deviation Calculator to check your results quickly.
What Is Mean Absolute Deviation?
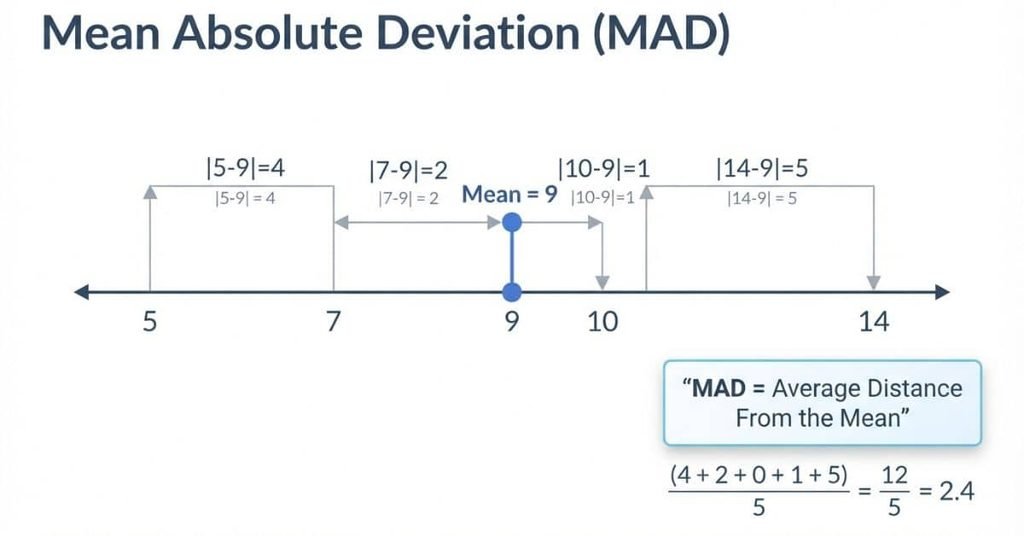
Mean Absolute Deviation (MAD) is a measure of how far data values usually sit from the mean. It helps you understand the spread of a data set using one simple number.
Want to check your calculation? Use our [Mean Absolute Deviation Calculator] to calculate MAD quickly and see the result step by step.
Data spread describes how much the values differ from each other. A data set with values close together has less spread. Values that sit farther apart have more spread.
MAD finds the distance between each value and the mean. It then averages those distances. Because MAD uses absolute values, negative and positive differences do not cancel each other out.
A smaller MAD means the values tend to stay closer to the mean. A larger MAD means the values tend to be farther from the mean.
For example, suppose a class records similar test scores. A low MAD suggests the scores are grouped near the class average. A higher MAD shows greater variation among the scores.
Pro Tip: Always use the same data set when comparing MAD values. This makes the comparison more meaningful.
Mean Absolute Deviation Formula
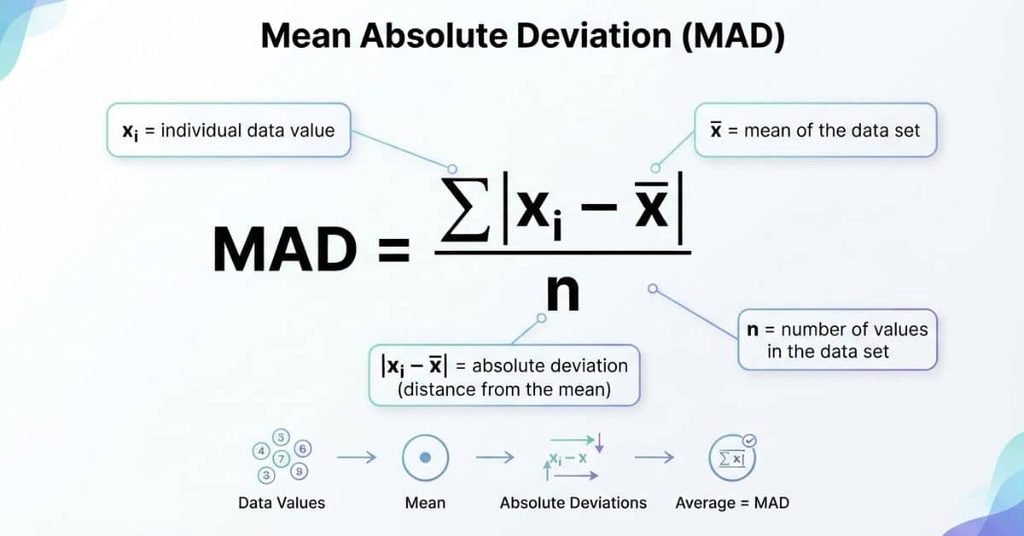
The Mean Absolute Deviation formula shows exactly how to calculate the average distance from the mean:
Each part of the formula has a specific meaning:
- xix_i — An individual value from the data set.
- xˉ\bar{x} — The mean, or average, of all data values.
- nn — The total number of values in the data set.
- ∣xi−xˉ∣|x_i-\bar{x}| — The absolute deviation of one value from the mean.
- ∑\sum — Add all the absolute deviations together.
The expression finds how far a value is from the mean. Absolute value removes the negative sign when a value falls below the mean.
You then add all absolute deviations and divide the total by . The result is the Mean Absolute Deviation.
For a complete calculation, you first find the mean. Next, find each deviation and convert it to an absolute value. Finally, average those absolute deviations to get MAD.
Save time on manual calculations with our free [Mean Absolute Deviation Calculator], built for quick and accurate MAD calculations.
How to Calculate Mean Absolute Deviation
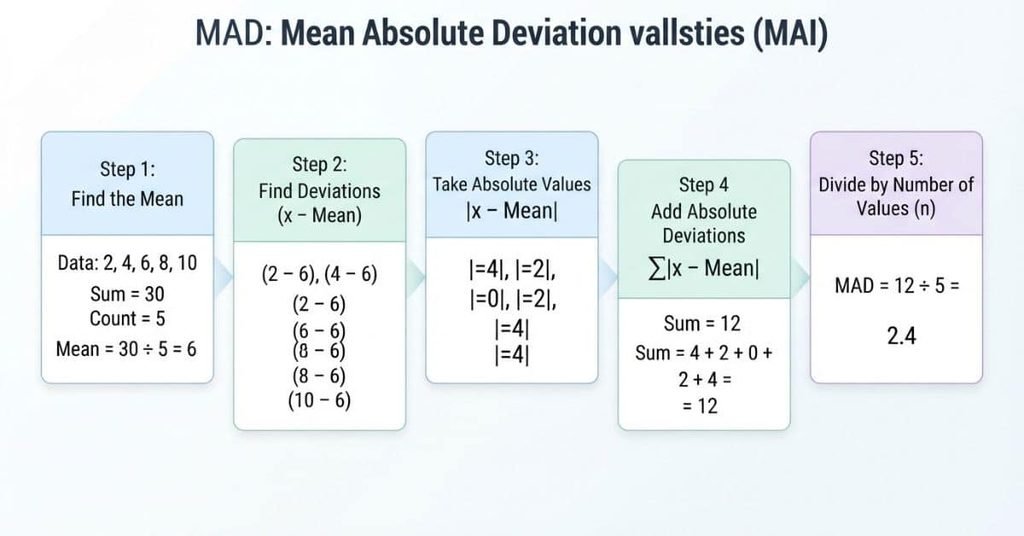
Learning how to calculate mean absolute deviation becomes easy when you follow the same five steps every time. We’ll use this data set:
2, 4, 6, 8, 10
The goal is to find the average distance of each value from the mean.
Step 1 — Find the Mean
First, add all five values together.
There are 5 data values, so divide the total by 5.
The mean is 6. We’ll use this mean to find how far each value sits from the center.
Step 2 — Find the Deviation From the Mean
Now subtract the mean from each data value. The mean is 6, so calculate for every value.
| Data Value () | Mean () | Deviation () |
|---|---|---|
| 2 | 6 | -4 |
| 4 | 6 | -2 |
| 6 | 6 | 0 |
| 8 | 6 | 2 |
| 10 | 6 | 4 |
The deviations show the direction and distance from the mean. Negative values fall below the mean, while positive values fall above it.
Step 3 — Find the Absolute Value of Each Deviation
MAD uses absolute deviations, so we remove the negative signs. Absolute value tells us the distance from the mean without considering direction.
Apply absolute value to each deviation:
The absolute deviations are therefore:
4, 2, 0, 2, 4
This step prevents negative and positive deviations from canceling each other.
Step 4 — Add the Absolute Deviations
Next, add all the absolute deviations together.
The sum of the absolute deviations is 12.
This total represents the combined distance of all five values from the mean.
Step 5 — Divide by the Number of Data Values
Finally, divide the total absolute deviation by the number of data values.
Therefore, the Mean Absolute Deviation is 2.4.
This means the data values are 2.4 units away from the mean on average.
Try the [Mean Absolute Deviation Calculator] with your own data set and see how each value affects the final MAD.
Mean Absolute Deviation Example
Let’s use a different data set to see the complete MAD calculation:
5, 7, 9, 10, 14
Step 1: Find the Mean
Add all five values:
Divide the total by 5:
The mean is 9.
Step 2: Find Each Deviation
Subtract the mean from every value.
| Value | Mean | Deviation | Absolute Deviation |
|---|---|---|---|
| 5 | 9 | -4 | 4 |
| 7 | 9 | -2 | 2 |
| 9 | 9 | 0 | 0 |
| 10 | 9 | 1 | 1 |
| 14 | 9 | 5 | 5 |
Step 3: Add the Absolute Deviations
Step 4: Divide by the Number of Values
There are 5 values:
So, the Mean Absolute Deviation is 2.4. On average, the data values are 2.4 units away from their mean.
How to Calculate Mean Absolute Deviation by Hand
You don’t need a calculator to find MAD. A clear table can help you complete the calculation accurately by hand.
Start by writing the data values in one column. Then calculate the mean before finding any deviations. Keep each calculation organized in separate columns.
| Value | Mean | Deviation | Absolute Deviation |
|---|---|---|---|
| 5 | 9 | -4 | 4 |
| 7 | 9 | -2 | 2 |
| 9 | 9 | 0 | 0 |
| 10 | 9 | 1 | 1 |
| 14 | 9 | 5 | 5 |
To avoid arithmetic mistakes, check each stage separately. First verify the mean. Then check every subtraction and absolute value. Finally, add the absolute deviations before dividing.
Expert Tip: Keep the original values unchanged. Write every intermediate result instead of calculating several steps mentally.
A useful hand-calculation routine is:
- Find the mean.
- Subtract the mean from each value.
- Convert deviations to absolute values.
- Add the absolute deviations.
- Divide by the number of values.
How to Calculate Mean Absolute Deviation From the Mean
Mean Absolute Deviation measures how far values typically fall from their mean. Each calculation follows a simple path:
Value → Mean → Deviation → Absolute Deviation → MAD
First, find the mean of the entire data set. Next, subtract the mean from each individual value. These results are called deviations.
Some deviations may be negative because those values fall below the mean. Take the absolute value of every deviation so all distances become positive.
Finally, add the absolute deviations and divide by the total number of data values. The result is the Mean Absolute Deviation.
For example, if a value is 5 and the mean is 9:
Its absolute deviation is:
You repeat this process for every value. This makes MAD an easy way to summarize the typical distance from the mean.
How to Interpret Mean Absolute Deviation
A MAD value becomes useful when you understand what it says about the data. It describes the typical distance between data values and their mean.
A small MAD means the values tend to stay close to the mean. A larger MAD means the values tend to sit farther from the mean. However, the size of MAD only makes sense when you consider the data and its units.
For example, a MAD of 2 could represent 2 points on a test, 2 inches in height, or 2 dollars in cost. The number has different meaning in each situation.
MAD is expressed in the same units as the original data. This makes it easier to interpret the amount of typical variation.
Expert Tip: Don’t call a MAD “small” or “large” without considering the data’s scale and context.
Mean Absolute Deviation vs. Standard Deviation
Both MAD and standard deviation measure the spread of data around the mean. However, they calculate that spread differently.
| Feature | Mean Absolute Deviation | Standard Deviation |
|---|---|---|
| Measures | Average absolute distance from the mean | Spread based on squared deviations |
| Uses absolute values? | Yes | No |
| Squares deviations? | No | Yes |
| Same units as data? | Yes | Yes |
| Effect of large deviations | Less emphasis | More emphasis |
| Common use | Simple measure of typical spread | Statistical analysis and inference |
MAD uses the absolute distance from the mean. Standard deviation squares each deviation before averaging and taking the square root.
Both measures describe variability, but they can produce different values for the same data set.
Mean Absolute Deviation vs. Mean Absolute Error
Mean Absolute Deviation and Mean Absolute Error (MAE) both use absolute differences. Their main difference comes from what those differences compare.
MAD usually measures the distance between each data value and the mean of the data.
MAE measures the average absolute difference between observed values and predicted or estimated values. It commonly evaluates prediction accuracy.
For example, MAD can describe how spread out test scores are around their average. MAE can describe how far predicted scores differ from actual scores.
So, MAD focuses on data spread, while MAE focuses on prediction error.
Can a Mean Absolute Deviation Be Zero?
Yes, Mean Absolute Deviation can be zero. This happens only when every data value is exactly the same as the mean.
For example, consider this data set:
The mean is 5. Each value has zero distance from the mean:
Therefore, every absolute deviation equals zero. Their average is also zero:
A MAD of zero means the data has no variation around the mean. Every value matches the mean exactly.
If even one value differs from the mean, the MAD becomes greater than zero. This makes zero the smallest possible MAD.
Use a Mean Absolute Deviation Calculator
Calculating MAD by hand helps you understand the process, but a calculator can save time and reduce arithmetic errors.
Enter your dataset into our free Mean Absolute Deviation Calculator to calculate MAD instantly and see the step-by-step calculation.
[Calculate Mean Absolute Deviation →]
Use the calculator to check your work, explore different data sets, and understand how each value affects the final MAD.
Conclusion
Mean Absolute Deviation gives you a simple way to understand how much data values vary from their mean. In this guide, you learned the MAD formula, calculation steps, examples, and how to interpret the result.
Learning how to calculate mean absolute deviation becomes easier when you follow each step carefully. Find the mean, calculate each deviation, use absolute values, add them, and divide by the number of values.
MAD can help you compare data spread without complicated calculations. Remember that MAD uses the same units as your original data.
Ready to check your answer? Use our free Mean Absolute Deviation Calculator for a quick, step-by-step calculation. You can also explore our other statistics calculators for more practice.
Frequently Asked Questions
Find clear answers to common questions about mean absolute deviation, its formula, calculation, and interpretation.
To calculate mean absolute deviation, first find the mean of the data set. Then find each value’s distance from the mean. Use absolute values so all distances become positive. Add the absolute deviations and divide their total by the number of data values.
The mean absolute deviation formula is MAD = Σ|xᵢ − x̄| ÷ n. Here, xᵢ represents each data value, x̄ represents the mean, and n represents the number of values. The formula averages the absolute distances from the mean.
Follow five basic steps to calculate MAD. Find the mean first, then subtract the mean from each value. Take the absolute value of each difference. Add all absolute deviations, then divide the total by the number of values.
You can calculate MAD by hand using a simple table. List each data value, find its deviation from the mean, and then find each absolute deviation. Add the absolute deviations and divide by the total number of values.
Mean absolute deviation tells you how far data values typically are from their mean. A smaller MAD means values tend to stay closer to the mean. A larger MAD indicates greater spread around the mean. MAD uses the same units as the original data.
A MAD of 0 means every data value equals the mean. In other words, all values in the data set are identical. Since every distance from the mean is zero, their average absolute deviation is also zero.
No. Both measure the spread of data around the mean, but they use different calculations. MAD uses absolute deviations, while standard deviation uses squared deviations before taking a square root. Standard deviation also gives more weight to larger deviations.
No. Mean absolute deviation measures how far data values are from their mean. Mean absolute error measures the average absolute difference between observed and predicted values. MAD describes data spread, while MAE commonly measures prediction or estimation error.

We are the StatisticsTools.com Development Team, dedicated to building accurate, easy-to-use statistical calculators and educational resources for students, educators, researchers, and professionals.
Our mission is to make statistics simple by providing free, reliable tools for data analysis, probability, hypothesis testing, regression, and other statistical calculations. We also create practical guides that explain statistical concepts in a clear and easy-to-understand way.
At StatisticsTools.com, we are continuously improving our platform by adding new calculators and educational resources to help users solve statistical problems quickly and confidently.