
Table of Contents
Introduction
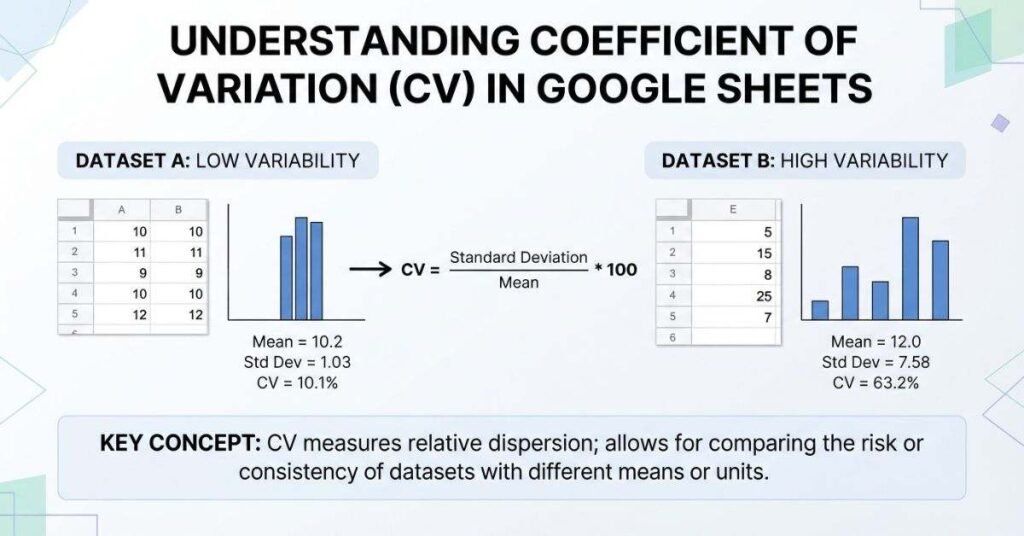
Have you ever compared two datasets and wondered which one has more consistent results?
The coefficient of variation, or CV, helps you compare variability across datasets with different means. It is especially useful when standard deviation alone does not tell the full story.
For beginners, calculating CV may seem complicated at first. However, Google Sheets makes the process quick with a few simple formulas. You do not need advanced statistics skills or special spreadsheet tools.
In this guide, you will learn how to calculate coefficient of variation in Google Sheets using clear, beginner-friendly steps. You will see the exact formulas for sample and population data.
We will also explain how to calculate CV as a percentage and avoid common spreadsheet mistakes. You will learn when to use STDEV.S versus STDEV.P.
By the end, you will be able to calculate CV confidently from your own data. You can also use the method to compare relative variability between datasets.
How to Calculate Coefficient of Variation in Google Sheets
The quickest way to calculate the coefficient of variation in Google Sheets is to divide standard deviation by the mean. For sample data, enter this formula in an empty cell:
=STDEV.S(A2:A10)/AVERAGE(A2:A10)This formula combines two Google Sheets functions:
- STDEV.S calculates the sample standard deviation.
- AVERAGE calculates the arithmetic mean.
- Division calculates the coefficient of variation.
The result appears as a decimal by default. To report CV as a percentage, select the result cell and click the Percent button in Google Sheets. For example, a result of 0.15 displays as 15%.
This approach keeps the calculation simple and reduces the chance of formatting errors. You don’t need a dedicated CV function to calculate the result.
What Is the Google Sheets Formula for Coefficient of Variation?
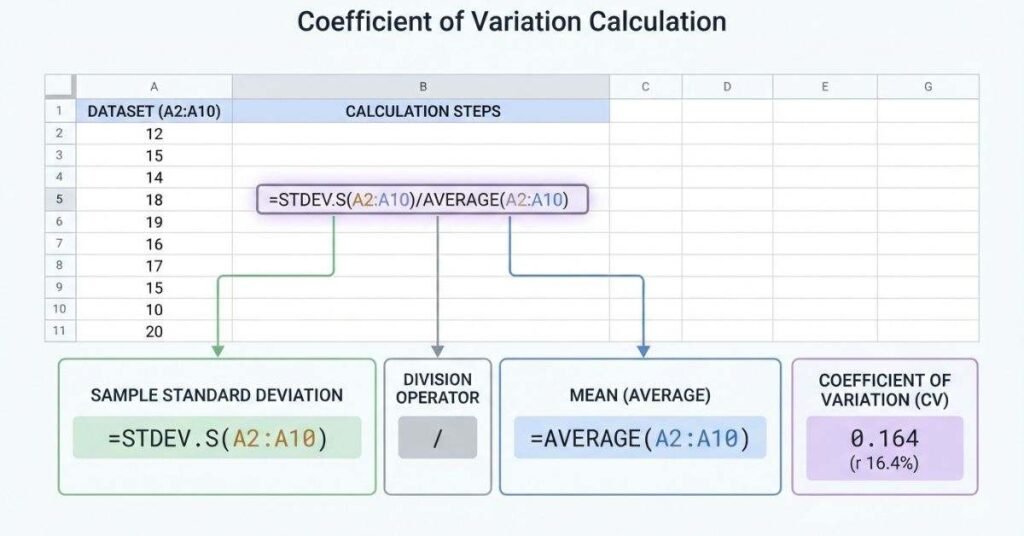
The correct formula depends on whether your data represents a sample or an entire population. For sample data, use:
=STDEV.S(A2:A10)/AVERAGE(A2:A10)Use STDEV.S when your values represent a sample taken from a larger population. This is common when you analyze measurements from a selected group rather than every possible observation.
For population data, use:
=STDEV.P(A2:A10)/AVERAGE(A2:A10)Use STDEV.P when your dataset includes the entire population you want to analyze. Both formulas divide standard deviation by the mean.
The main difference comes from how Google Sheets calculates standard deviation. Choosing the correct function ensures your coefficient of variation matches your data type.
Step-by-Step: Calculate CV in Google Sheets
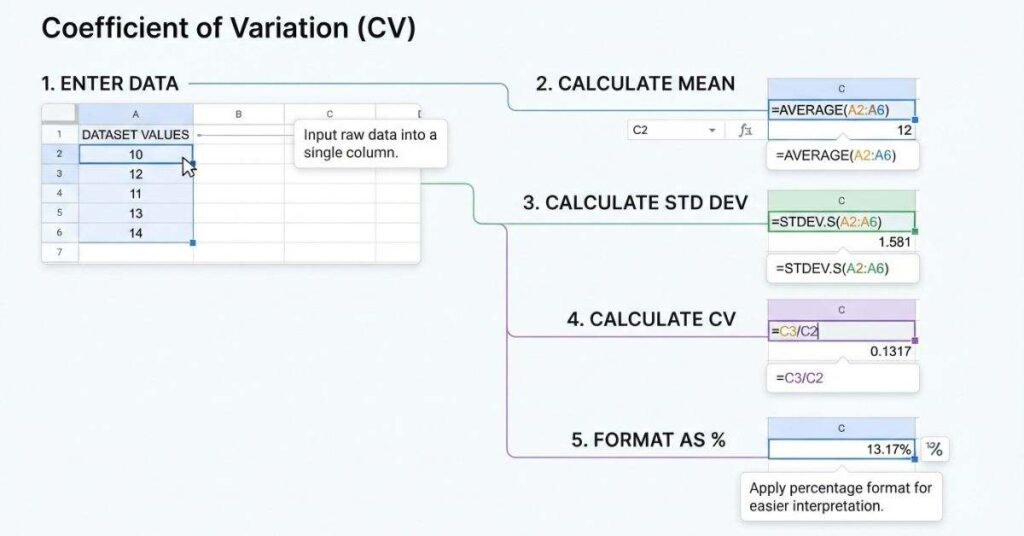
Calculating CV in Google Sheets takes only a few simple steps. Start with a small dataset in column A, such as:
| Cell | Value |
|---|---|
| A2 | 10 |
| A3 | 12 |
| A4 | 11 |
| A5 | 13 |
| A6 | 14 |
Step 1: Enter Your Data
Place each value in its own cell under a single column. Keep the data together without blank cells between values.
Step 2: Calculate the Mean
Select an empty cell and enter:
=AVERAGE(A2:A6)This formula adds the values and divides their total by the number of observations.
Step 3: Calculate Standard Deviation
In another empty cell, enter:
=STDEV.S(A2:A6)This calculates the sample standard deviation for your dataset.
Step 4: Calculate CV
Now enter the complete CV formula:
=STDEV.S(A2:A6)/AVERAGE(A2:A6)Google Sheets returns the coefficient of variation as a decimal.
Step 5: Format the Result as a Percentage
Select the CV result cell, then click the Percent (%) button in the Google Sheets toolbar. You can also use Format → Number → Percent.
For this example, the sample CV is approximately 13.18%.
Pro Tip: Keep the original CV formula as a decimal and use percentage formatting. This makes later calculations easier and prevents double conversion.
Sample vs. Population CV in Google Sheets
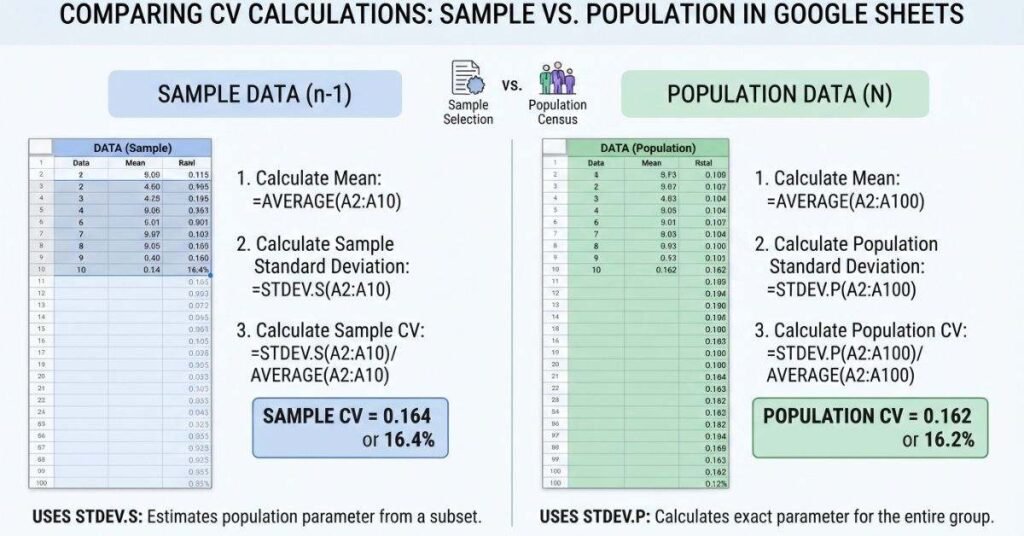
Should You Use STDEV.S or STDEV.P?
Choosing the correct standard deviation function depends on what your data represents. Using the wrong function can produce a CV that doesn’t match your statistical goal.
Use STDEV.S when your values are a sample from a larger population:
=STDEV.S(A2:A6)/AVERAGE(A2:A6)For example, you might analyze measurements from a selected group when many similar observations exist.
Use STDEV.P when your values represent the entire population you’re studying:
=STDEV.P(A2:A6)/AVERAGE(A2:A6)For example, you might have data for every member of a defined group. The key question is simple: Are these values a sample, or do they include the entire population?
Takeaways
- Use
STDEV.Sfor sample data. - Use
STDEV.Pfor complete population data. - Divide standard deviation by the mean to calculate CV.
- Format the CV result as a percentage when needed.
Coefficient of Variation Example in Google Sheets
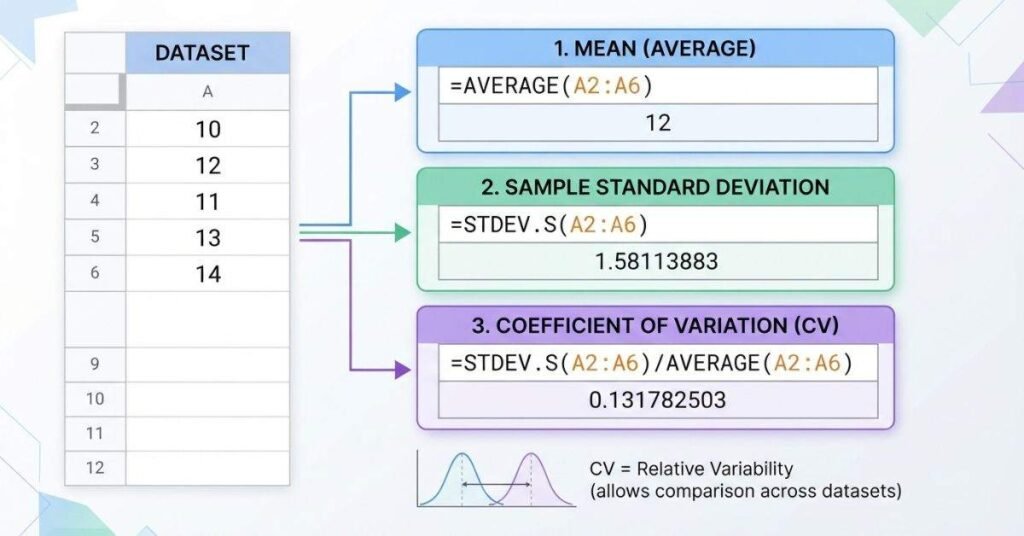
Let’s use a simple dataset to see how CV works in Google Sheets. Enter these values in cells A2:A6:
| Cell | Value |
|---|---|
| A2 | 10 |
| A3 | 12 |
| A4 | 11 |
| A5 | 13 |
| A6 | 14 |
First, calculate the mean in an empty cell:
=AVERAGE(A2:A6)The mean is 12. Next, calculate the sample standard deviation:
=STDEV.S(A2:A6)The sample standard deviation is approximately 1.581.
Now calculate the coefficient of variation:
=STDEV.S(A2:A6)/AVERAGE(A2:A6)The result is approximately 0.1318, or 13.18% when formatted as a percentage.
A CV of 13.18% means the standard deviation is about 13.18% of the mean. This gives you a relative measure of variability rather than an absolute one.
Expert Tip: CV works best when the mean is positive and meaningfully different from zero. Values close to zero can make CV unstable or misleading.
How to Calculate CV as a Percentage in Google Sheets
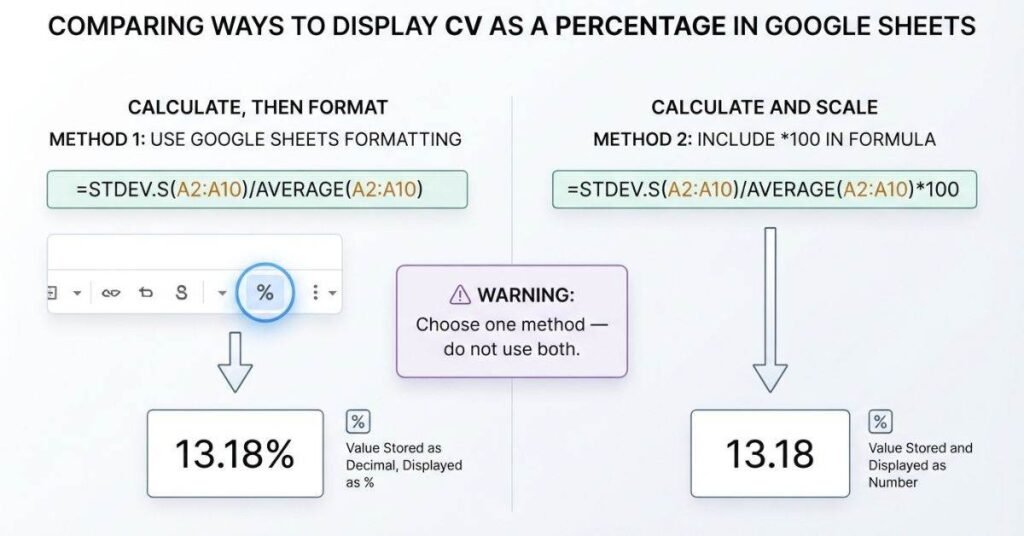
Google Sheets gives you two correct ways to display CV as a percentage. Choose one method, not both.
Method 1 — Use Percentage Formatting
Enter the standard CV formula:
=STDEV.S(A2:A10)/AVERAGE(A2:A10)Google Sheets returns the CV as a decimal. Select the result cell and click the % button in the toolbar. You can also choose Format → Number → Percent.
For example, a decimal result of 0.1318 displays as 13.18%.
Method 2 — Multiply the Result by 100
You can also convert the decimal directly into a percentage:
=STDEV.S(A2:A10)/AVERAGE(A2:A10)*100Keep the result cell formatted as a normal number. A result of 13.18 represents 13.18%.
Important: Don’t multiply by 100 and then apply percentage formatting. Doing both converts the value twice and produces an incorrect result.
How to Find Coefficient of Variation in Google Sheets
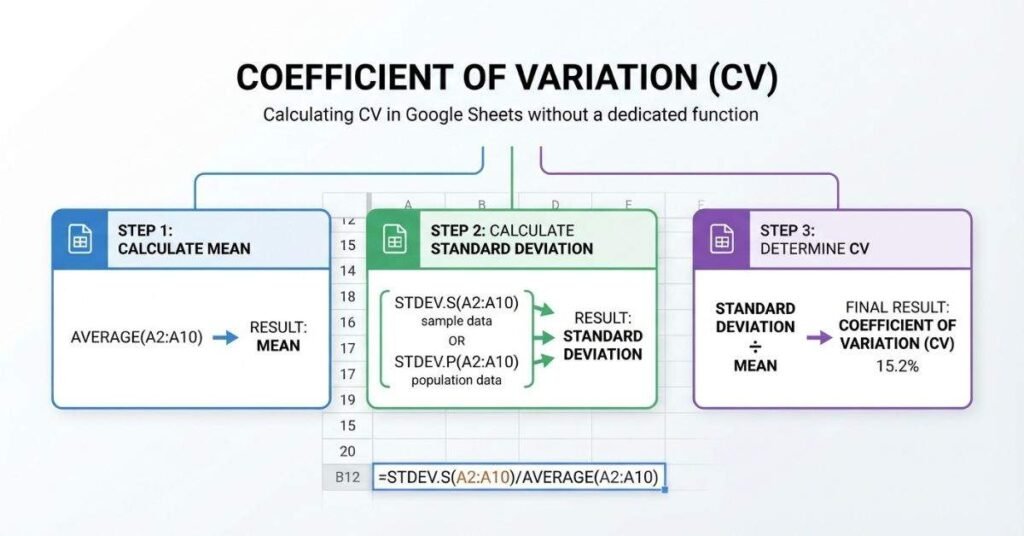
Google Sheets doesn’t require a dedicated COEFFICIENTOFVARIATION function to calculate CV. You can create the calculation by combining standard spreadsheet functions.
For sample data, use:
=STDEV.S(A2:A10)/AVERAGE(A2:A10)For population data, use:
=STDEV.P(A2:A10)/AVERAGE(A2:A10)The formula uses AVERAGE to find the mean and STDEV.S or STDEV.P to find standard deviation. Dividing standard deviation by the mean gives the coefficient of variation.
This approach makes CV calculations simple for beginners. You only need to understand which standard deviation function matches your dataset.
Expert Tip: If your data represents a sample from a larger group, use
STDEV.S. UseSTDEV.Pwhen your data covers the entire population.
Common Mistakes When Calculating CV in Google Sheets
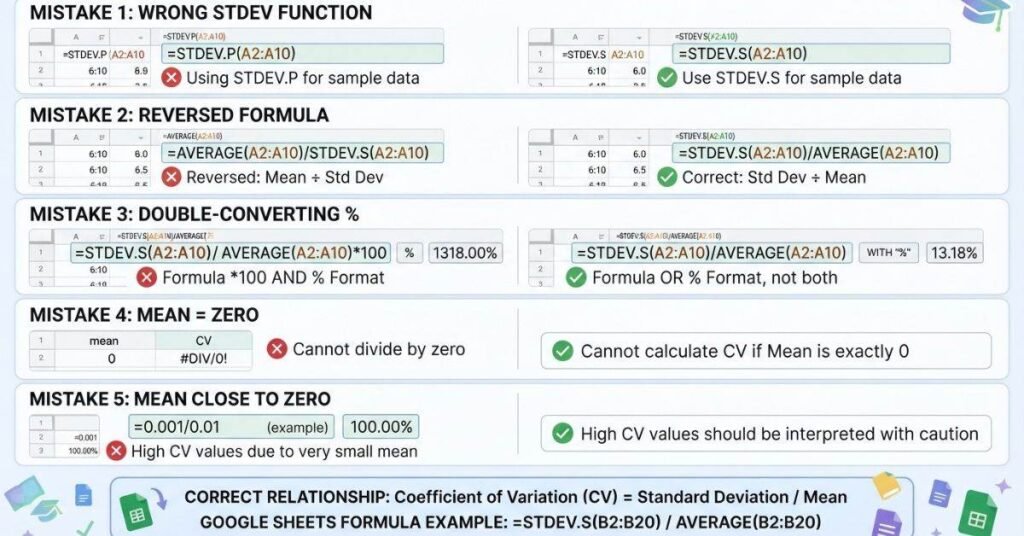
Calculating CV is straightforward, but a few common mistakes can change the result. Checking your formula and data type can help you avoid these errors.
Using the Wrong Standard Deviation Function
Use STDEV.S for sample data and STDEV.P for an entire population. Choosing the wrong function can give you an inappropriate CV for your dataset.
Reversing the Formula
Always divide standard deviation by the mean:
=STDEV.S(A2:A10)/AVERAGE(A2:A10)Don’t divide the mean by standard deviation. That calculates a different value.
Double-Converting the Percentage
Don’t multiply the formula by 100 and then format the cell as a percentage. Choose one approach.
Mean Is Zero
CV divides standard deviation by the mean. A zero mean makes the calculation undefined because division by zero isn’t possible.
Mean Is Close to Zero
A mean close to zero can produce an extremely large CV. Such a result may not provide a useful measure of relative variability.
Google Sheets vs. Excel for Calculating CV
Google Sheets and Excel use essentially the same calculation for the coefficient of variation. Both provide the standard functions needed to calculate CV.
| Feature | Google Sheets | Excel |
|---|---|---|
AVERAGE | ✓ | ✓ |
STDEV.S | ✓ | ✓ |
STDEV.P | ✓ | ✓ |
| CV calculation | ✓ | ✓ |
The main difference is the spreadsheet platform, not the statistical method. You can calculate CV by dividing standard deviation by the mean in either program.
If you want to calculate CV in Excel, see How to Calculate Coefficient of Variation in Excel for the corresponding formulas and steps.
Calculate Coefficient of Variation From Your Data
You now know how to calculate coefficient of variation in Google Sheets using simple formulas. You also learned when to use STDEV.S or STDEV.P, how to format CV as a percentage, and which common mistakes to avoid.
If you already know the mean and standard deviation, you don’t need a spreadsheet. Our free Coefficient of Variation Calculator can calculate CV instantly from your data. It can save time when you only need a quick result.
Use the Coefficient of Variation Calculator
Keep these simple steps in mind: divide standard deviation by the mean, then interpret the result carefully. A CV can help you compare relative variability between datasets.
Ready to check your numbers? Try the calculator, then explore more statistics guides on our website.
Conclusion
Calculating CV in Google Sheets is simple once you understand the basic formula. You can combine AVERAGE with STDEV.S or STDEV.P to find relative variability.
This guide showed you how to calculate coefficient of variation in Google Sheets, format CV as a percentage, and choose the correct standard deviation function. You also learned how to avoid common errors, including double percentage conversion and zero means.
If you already have the mean and standard deviation, you can skip the spreadsheet work. Use our free Coefficient of Variation Calculator to get your result quickly.
Ready to check your data? Try the calculator, or explore our other statistics guides for more practical examples and formulas.
Frequently Asked Questions
To calculate CV in Google Sheets, divide the standard deviation by the mean. For sample data, use:
STDEV.S calculates the sample standard deviation, while
AVERAGE calculates the mean. Format the result as a percentage
if you want to display CV as a percentage.
The basic CV formula is standard deviation divided by the mean. For sample data, enter:
For a complete population, use STDEV.P instead:
Choose the formula based on whether your data represents a sample or the entire population.
Google Sheets does not require a dedicated coefficient of variation function.
You can calculate CV by combining AVERAGE with
STDEV.S or STDEV.P.
For sample data, use:
This approach uses standard Google Sheets functions and works well for basic CV calculations.
Enter the CV formula without multiplying by 100:
Select the result cell and click the Percent (%) button in the toolbar. You can also choose Format → Number → Percent.
Avoid multiplying by 100 if you already use percentage formatting. Otherwise, you will convert the result twice.
Use STDEV.S when your data represents a sample from
a larger population. Use STDEV.P when your dataset
contains the entire population you want to analyze.
Sample CV:
Population CV:
Choosing the correct function helps ensure your CV matches your statistical analysis.
Yes. Google Sheets can calculate coefficient of variation using standard spreadsheet functions. It does not need a special CV function.
Use AVERAGE to calculate the mean and
STDEV.S or STDEV.P for standard deviation.
Then divide standard deviation by the mean.
This method works for both sample and population datasets.
First, calculate the mean with:
Then calculate sample standard deviation with:
Finally, calculate CV with:
You can place each formula in a separate cell and format the final CV cell as a percentage when needed.
CV cannot be meaningfully calculated when the mean equals zero. The formula divides standard deviation by the mean, so a zero mean creates division by zero.
Google Sheets will return an error instead of a valid CV. You should not replace the result with an arbitrary value.
A mean close to zero can make the CV extremely large or unstable. Small changes in the mean can cause large changes in the final ratio.
For this reason, interpret CV carefully when the mean approaches zero. Another measure of variability may provide more useful information in some situations.
No. Standard deviation measures absolute variability around the mean. CV measures variability relative to the mean.
Standard deviation uses the original measurement units, while CV expresses variability as a ratio or percentage of the mean. This makes CV useful for comparing datasets with different scales.
Yes. Use STDEV.P when your values represent the entire
population being analyzed.
This calculates population standard deviation and divides it by the population mean. Format the result as a percentage if required.
Google Sheets normally returns CV as a decimal when you use the standard formula.
For example, a result of 0.1318 represents approximately 13.18%. Select the result cell and use the Percent (%) formatting option.
Don’t multiply by 100 if you already apply percentage formatting.
Yes. You only need the mean and standard deviation to calculate CV manually.
If you want a faster option, you can use a free Coefficient of Variation Calculator to calculate the result without entering spreadsheet formulas.

We are the StatisticsTools.com Development Team, dedicated to building accurate, easy-to-use statistical calculators and educational resources for students, educators, researchers, and professionals.
Our mission is to make statistics simple by providing free, reliable tools for data analysis, probability, hypothesis testing, regression, and other statistical calculations. We also create practical guides that explain statistical concepts in a clear and easy-to-understand way.
At StatisticsTools.com, we are continuously improving our platform by adding new calculators and educational resources to help users solve statistical problems quickly and confidently.