
Table of Contents
Introduction
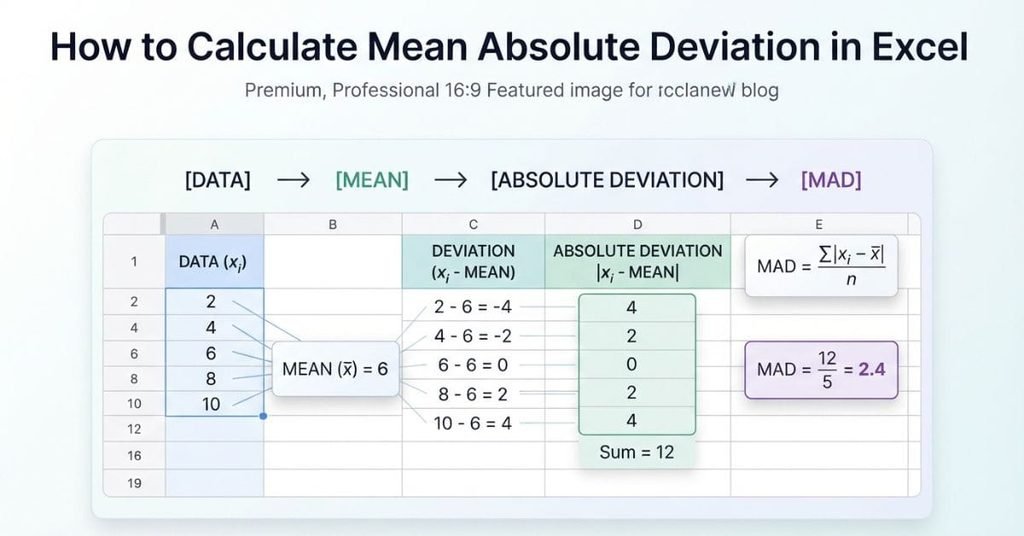
Have you ever needed to calculate mean absolute deviation in Excel and felt unsure where to start?
Mean absolute deviation (MAD) shows how far data values typically are from the mean. It is useful in statistics, data analysis, and classroom assignments. For beginners, calculating MAD by hand can involve several repetitive steps.
Excel can make these calculations faster and easier. You can organize your data, find the mean, calculate deviations, and get the final MAD with simple formulas.
In this guide, you will learn how to calculate mean absolute deviation in Excel step by step. You will see which Excel formulas to use and how each step works. We will also walk through a simple example with sample data.
By the end, you will know how to calculate MAD in Excel with confidence. You will also understand what your result means in a statistics problem.
What Is Mean Absolute Deviation?
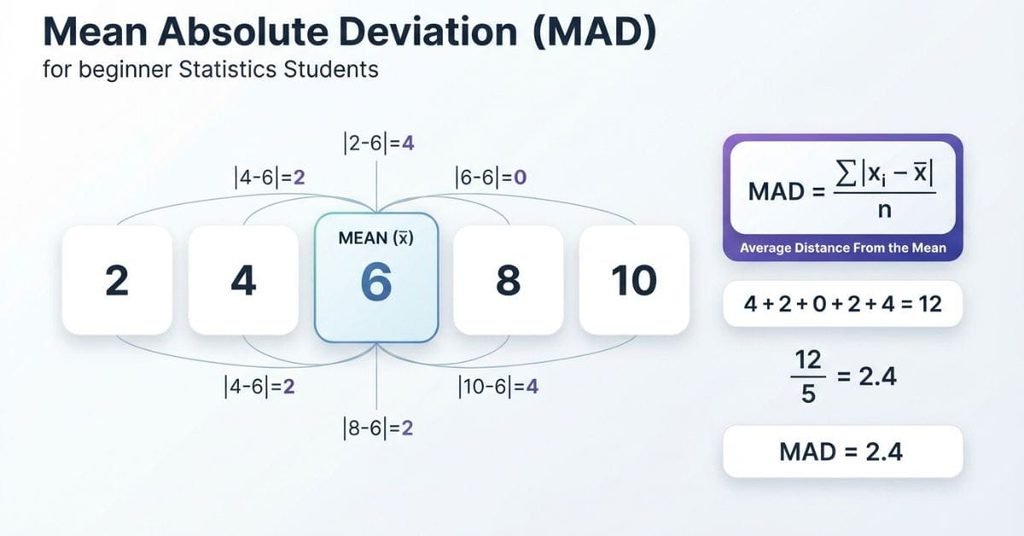
Mean absolute deviation (MAD) measures how far data values are from the mean. It gives the average distance between each value and the dataset’s mean.
To calculate MAD, find the mean first. Then, find each value’s absolute difference from the mean. Finally, average those absolute differences.
MAD is useful when you want to understand the spread of a dataset. A smaller MAD means values stay closer to the mean. A larger MAD means the values vary more.
If you want to explore the concept and calculation in more detail, you can also use our [Mean Absolute Deviation Calculator] to check your results.
Mean Absolute Deviation Formula
The mean absolute deviation formula finds the average distance between each data value and the mean.
Here, each symbol has a simple meaning:
- xix_i = an individual data value
- xˉ\bar{x} = the mean of the dataset
- ∣xi−xˉ∣|x_i-\bar{x}| = the absolute deviation from the mean
- ∑\sum = add all absolute deviations
- nn = total number of data values
To use the formula, first calculate the mean. Then find each value’s absolute deviation from that mean. Add those deviations and divide the total by the number of values.
In Excel, you can perform these steps with formulas instead of calculating every value by hand.
Want to check your Excel calculation? Use our [Mean Absolute Deviation Calculator] to calculate MAD quickly and verify your result.
How to Calculate Mean Absolute Deviation in Excel
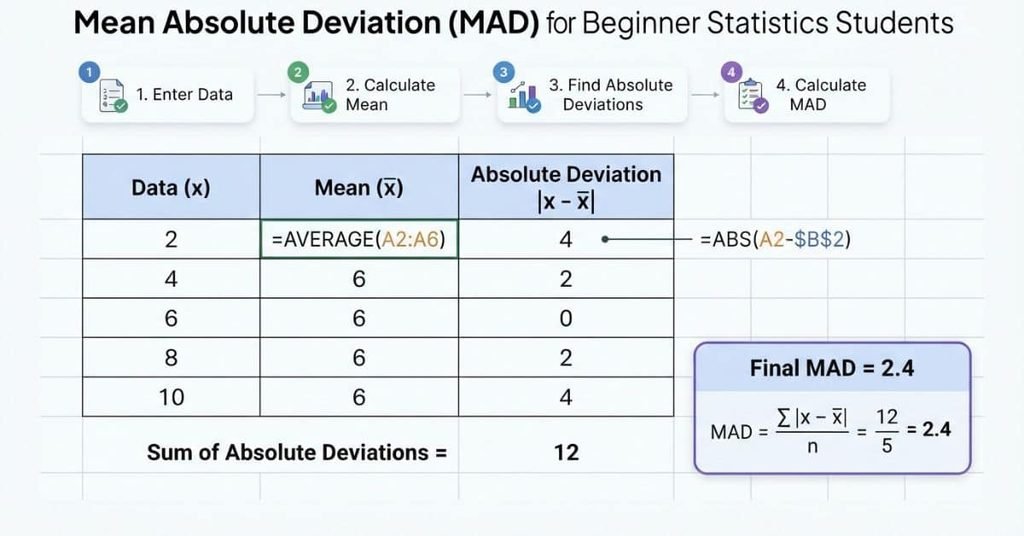
Excel can calculate mean absolute deviation with a few simple formulas. The key is to keep each step separate so you can check your work.
We’ll use the dataset 2, 4, 6, 8, and 10. This example uses standard worksheet formulas and makes each calculation easy to verify.
Before working with Excel, it helps to understand the basic concept, formula, and calculation steps. Read our guide on [How to Calculate Mean Absolute Deviation: Formula & Examples] for a complete explanation with examples.
Step 1 — Enter Your Data
Start by entering your values in one Excel column. Put the heading Data in cell A1, then enter the numbers below it.
| Cell | Value |
|---|---|
| A1 | Data |
| A2 | 2 |
| A3 | 4 |
| A4 | 6 |
| A5 | 8 |
| A6 | 10 |
Keeping the values in one continuous range makes your formulas easier to read. It also helps you avoid accidentally leaving out a data value.
Step 2 — Calculate the Mean
The first calculation is the dataset’s mean. In another cell, such as B2, enter:
=AVERAGE(A2:A6)Press Enter, and Excel returns 6.
The AVERAGE function adds the values and divides their total by the number of values. You can use this mean in the next step to find each value’s distance from the center.
Step 3 — Calculate Each Absolute Deviation
Now calculate how far each value is from the mean. Enter Absolute Deviation in B1.
In B2, enter:
=ABS(A2-$B$2)Then copy the formula down through B6.
The ABS function returns the absolute value, so Excel does not keep negative deviations. The dollar signs make B2 an absolute reference, keeping the mean fixed when you copy the formula.
Your results should look like this:
| Data | Absolute Deviation |
|---|---|
| 2 | 4 |
| 4 | 2 |
| 6 | 0 |
| 8 | 2 |
| 10 | 4 |
Step 4 — Calculate the Mean Absolute Deviation
Once you have all absolute deviations, average them. In B7, enter:
=AVERAGE(B2:B6)Excel returns:
MAD = 2.4
This works because the absolute deviations are 4, 2, 0, 2, and 4. Their sum is 12, and there are 5 data values.
Step 5 — Check Your Result
A quick manual check helps confirm that your Excel formulas work correctly.
For this dataset, the mean is 6. The absolute deviations are 4, 2, 0, 2, and 4. Their average is 2.4, which matches the Excel result.
Pro Tip: Keep the mean in a separate cell and use an absolute reference like $B$2. This makes your worksheet easier to audit and reduces formula errors.
Example: Calculate MAD in Excel
Let’s work through a complete example using a small dataset. This makes each Excel step easy to follow and verify.
Suppose your data values are 12, 15, 18, 20, and 25. Enter them in cells A2:A6.
Data
| Cell | Data |
|---|---|
| A2 | 12 |
| A3 | 15 |
| A4 | 18 |
| A5 | 20 |
| A6 | 25 |
Mean
In B2, calculate the mean:
=AVERAGE(A2:A6)The result is 18.
Absolute Deviations
In B3, you can calculate the first absolute deviation with:
=ABS(A2-$B$2)Copy this formula down for all five values.
| Data | Absolute Deviation |
|---|---|
| 12 | 6 |
| 15 | 3 |
| 18 | 0 |
| 20 | 2 |
| 25 | 7 |
The absolute deviations add up to 18.
MAD
Now calculate their average:
=AVERAGE(B3:B7)The result is:
So, the mean absolute deviation is 3.6.
This means the data values are 3.6 units away from the mean on average. The example also gives you a simple way to check your Excel result against a manual calculation.
Ready to verify your answer? Try our [Mean Absolute Deviation Calculator] for a quick and accurate MAD calculation.
How to Calculate MAD in Excel With One Formula
You can also calculate MAD without creating a separate column for every absolute deviation. This approach combines the mean, absolute deviations, and final average into one formula.
For newer Excel versions that support dynamic array functions, you can use:
=AVERAGE(ABS(A2:A6-AVERAGE(A2:A6)))Here’s what Excel does inside the formula:
AVERAGE(A2:A6)calculates the dataset mean.A2:A6-AVERAGE(A2:A6)finds each value’s deviation.ABS(...)converts those deviations to absolute values.- The outer
AVERAGE(...)calculates the MAD.
For the example above, this formula returns 3.6.
Compatibility note: Excel versions handle array calculations differently. Microsoft 365 and newer Excel versions support dynamic arrays, while older versions may require array-entry behavior. If the one-formula method does not work in your Excel version, use the separate-column method from the previous section. It is easier to troubleshoot and verify.
Common Mistakes When Calculating MAD in Excel
Excel makes MAD calculations easier, but small formula errors can change the result. Check these common mistakes before accepting your answer.
- Forgetting absolute value: MAD uses the distance from the mean. Use
ABS()so negative deviations become positive. - Using the wrong mean: Calculate the mean from the same dataset used for MAD. Do not use a mean from another range.
- Including blank or non-data cells incorrectly: Check your selected range carefully. Make sure it contains the observations you want to analyze.
- Dividing by the wrong number: MAD divides the sum of absolute deviations by the number of observations, .
- Mixing MAD with MAE: Mean absolute deviation describes spread around a central value, usually the mean. Mean absolute error measures prediction errors against actual values.
Pro Tip: Check your data range before copying formulas. A single missing or extra observation can change both the mean and MAD.
For a deeper explanation of the MAD formula and how each part works, see our [Mean Absolute Deviation formula and examples guide].
Mean Absolute Deviation in Excel vs. Manual Calculation
Excel and manual calculation use the same mathematical process. The main difference is how you perform the repeated steps.
| Method | How it works | Best for |
|---|---|---|
| Excel | Uses formulas to calculate the mean, deviations, and MAD | Larger datasets and quick checks |
| Manual | Calculates each step by hand | Learning the concept and showing work |
For a small dataset, manual calculation helps you understand how MAD works. Excel becomes more useful when your dataset contains many values.
You can also use both methods together. Calculate MAD manually first, then use Excel to verify your result. Matching results provide a useful check for formula or arithmetic errors.
If you want to compare the Excel method with a manual calculation, explore our [How to Calculate Mean Absolute Deviation: Formula & Examples] guide for step-by-step examples.
Use Our Mean Absolute Deviation Calculator
Want to check your Excel result quickly? Use our [Mean Absolute Deviation Calculator] to calculate MAD without setting up formulas manually.
Enter your data, calculate the mean absolute deviation, and compare the result with your Excel worksheet.
[Calculate Mean Absolute Deviation →]
The calculator is especially useful when you want to verify your Excel work, check homework, or understand how the final MAD value was obtained.
Conclusion
Calculating mean absolute deviation in Excel becomes simple once you understand each step. You learned how to enter data, find the mean, calculate absolute deviations, and verify MAD.
The step-by-step method helps you understand the calculation instead of relying on one formula. You also learned how to calculate MAD with a single Excel formula and avoid common mistakes.
Now you know how to calculate mean absolute deviation in Excel with greater confidence. You can use the same process for many statistics assignments and datasets.
Ready to check your result? Try our Mean Absolute Deviation Calculator for a quick calculation and easy verification. Explore our other statistics calculators for more beginner-friendly tools and examples.
Frequently Asked Questions
Enter your data in one column, then use AVERAGE() to calculate the mean.
Next, use ABS() to find each value’s absolute deviation from the mean.
Finally, use AVERAGE() on those deviations to calculate MAD.
For newer Excel versions, you can use the following formula:
This formula calculates the mean, finds each absolute deviation, and averages those deviations. You can also calculate each step in separate cells for easier checking.
Use the ABS() function to find the absolute deviation from the mean.
For example, if the mean is stored in B2, use:
Copy the formula down to calculate the absolute deviation for each data value. The dollar signs keep the mean cell fixed when you copy the formula.
Yes. Excel can calculate MAD using separate formulas or one combined formula. The separate-column method shows each step clearly and makes errors easier to find. A combined formula can save time once you understand the calculation.
The easiest method for beginners is to use separate columns.
First, enter your data and calculate the mean with AVERAGE().
Then calculate each absolute deviation with ABS(), and average those results.
If your data is in cells A2 through A6, calculate the mean with:
Next, calculate each absolute deviation with ABS().
Then average the resulting values to find MAD.
For example, =AVERAGE(B3:B7) calculates MAD when the deviations are in B3:B7.
MAD measures the distance between each value and the mean.
Some deviations are negative, while others are positive.
The ABS() function converts them into non-negative distances.
This prevents positive and negative deviations from canceling each other.
Both MAD and standard deviation measure the spread of data around the mean. MAD uses absolute deviations, while standard deviation uses squared deviations. Standard deviation then takes the square root of the resulting average. Because they use different methods, their values can differ for the same dataset.
You can verify your result by calculating MAD manually. Find the mean, calculate every absolute deviation, add them, and divide by the number of observations. Your manual result should match the Excel result when you use the same data and method.
Yes. In newer Excel versions, you can use:
This combines the main calculation steps into one formula. If your Excel version does not handle the formula as expected, use the separate-column method instead.

We are the StatisticsTools.com Development Team, dedicated to building accurate, easy-to-use statistical calculators and educational resources for students, educators, researchers, and professionals.
Our mission is to make statistics simple by providing free, reliable tools for data analysis, probability, hypothesis testing, regression, and other statistical calculations. We also create practical guides that explain statistical concepts in a clear and easy-to-understand way.
At StatisticsTools.com, we are continuously improving our platform by adding new calculators and educational resources to help users solve statistical problems quickly and confidently.