
Table of Contents
Introduction
Have you ever compared two datasets and wondered which one is actually more variable?
Standard deviation shows how much data spreads around its average. However, it does not always show which dataset has greater relative variation. This matters when comparing measurements with different means or scales.
The what is coefficient of variation question becomes important in these situations. The coefficient of variation, or CV, compares standard deviation with the mean. It shows variability relative to the average value.
For beginners in the USA, CV can make statistical comparisons much easier to understand. It is used in areas such as science, finance, laboratory research, and quality control.
In this guide, you will learn what coefficient of variation means and why it matters. We will cover the coefficient of variation formula, interpretation, examples, and limitations. You will also learn when CV is more useful than standard deviation.
If you need a quick result, you can also use our Coefficient of Variation Calculator. Simply enter your mean and standard deviation to calculate CV instantly.
What Is Coefficient of Variation?
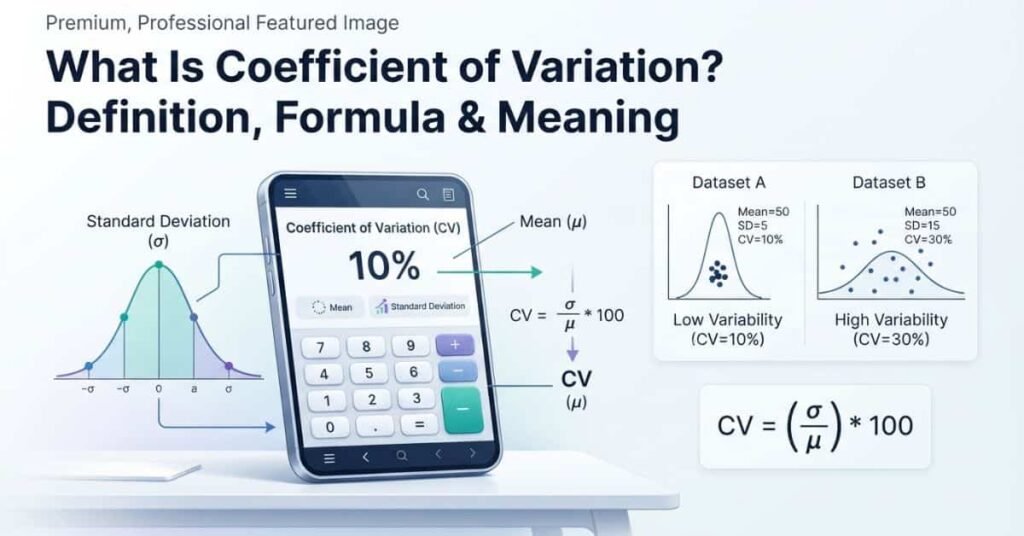
The coefficient of variation (CV) is a statistical measure of relative variability. It compares a dataset’s standard deviation with its mean. Researchers commonly express CV as a percentage, which makes comparisons easier to understand.
In simple terms, CV shows how much variation exists compared with the average value. A smaller CV usually means the data values are more consistent around their mean. A larger CV indicates more variation relative to that mean.
So, what is coefficient of variation in practical terms? It helps you judge variability based on the size of the average. This makes CV useful when two datasets have different means but need comparison.
For example, a standard deviation of 10 may seem large for one dataset. It may seem small for another dataset with a much larger mean. CV puts that variation into context.
The coefficient of variation is also called the relative standard deviation in some fields. You can calculate it by dividing the standard deviation by the mean, then multiplying by 100.
Want to calculate CV without doing the math manually? Use our Coefficient of Variation Calculator to get your result instantly.
What Does Coefficient of Variation Mean?
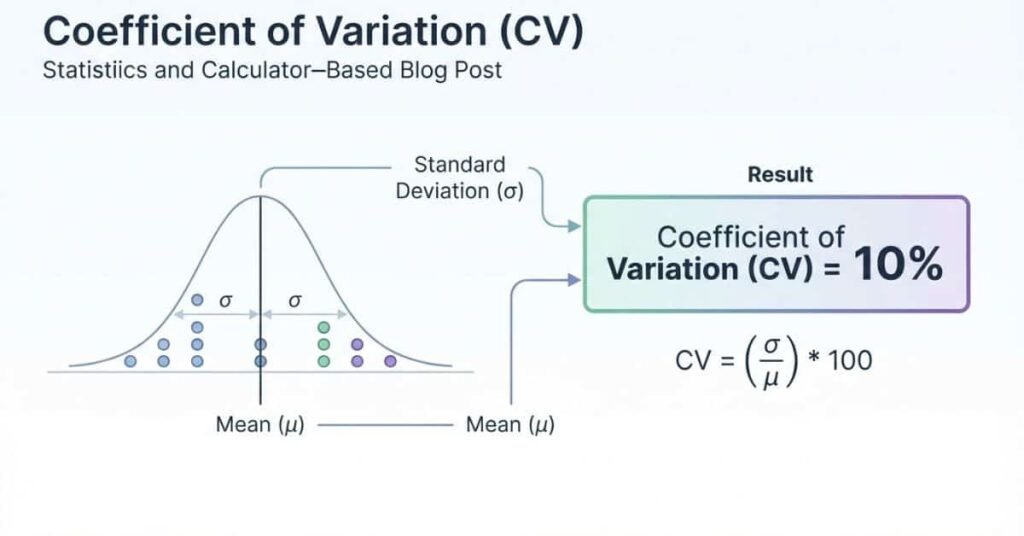
The coefficient of variation tells you how large the variation is compared with the dataset’s average. It gives you a relative measure instead of looking at spread alone.
For example, imagine two datasets with different coefficient of variation values:
- Dataset A: CV = 5%
- Dataset B: CV = 20%
Dataset B has greater variability relative to its mean. Its values show more spread compared with the average value.
So, what does coefficient of variation mean when you see a percentage? The percentage represents the standard deviation as a proportion of the mean. A 5% CV means the standard deviation equals 5% of the mean.
A lower CV generally suggests greater consistency relative to the average. A higher CV generally suggests more relative variation. However, you should always consider the context before deciding whether a CV is acceptable.
This answers what coefficient of variation tells you: it shows how variable a dataset is relative to its mean. That makes CV especially helpful when comparing datasets with different averages or measurement scales.
Pro Tip: Compare CV values only when the datasets represent meaningful and comparable measurements. A percentage alone does not determine whether variation is good or bad.
What Does CV Stand for in Statistics?
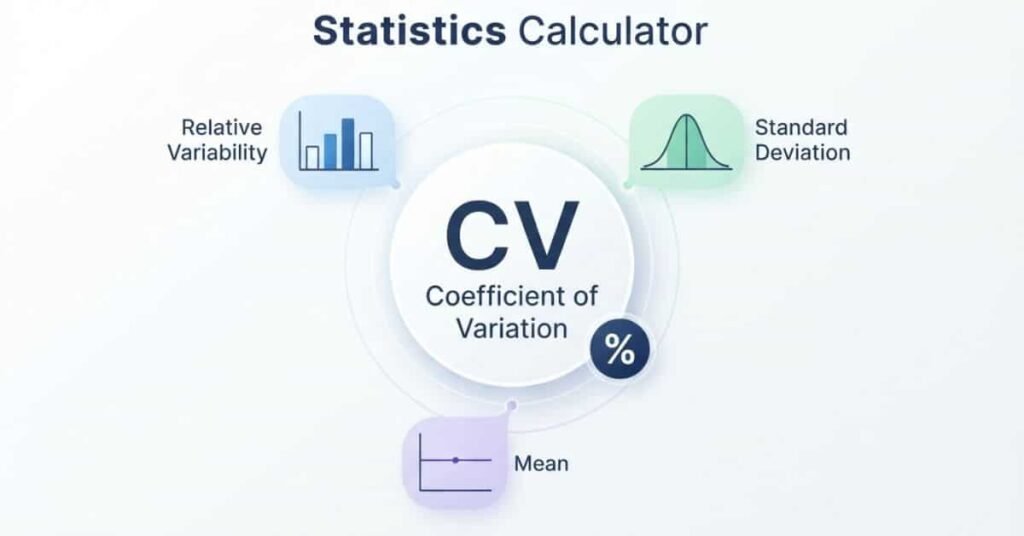
CV stands for Coefficient of Variation in statistics. It measures relative variability by comparing a dataset’s standard deviation with its mean.
So, what does CV mean in statistics? It shows how much variation exists compared with the average value. This makes CV useful for comparing datasets with different means.
CV in statistics is usually reported as a percentage. A higher percentage generally indicates greater variability relative to the mean. A lower percentage generally indicates greater consistency.
You may also see searches such as “what is CV statistics” or “what is CV in stats.” They all refer to the same statistical concept: the Coefficient of Variation.
CV appears in many areas, including scientific research, finance, laboratory analysis, and quality control. It can help researchers compare relative variation across suitable datasets.
Pro Tip: Always check the mean before interpreting CV. Values near zero can make CV unstable or difficult to interpret.
What Is the Coefficient of Variation Formula?
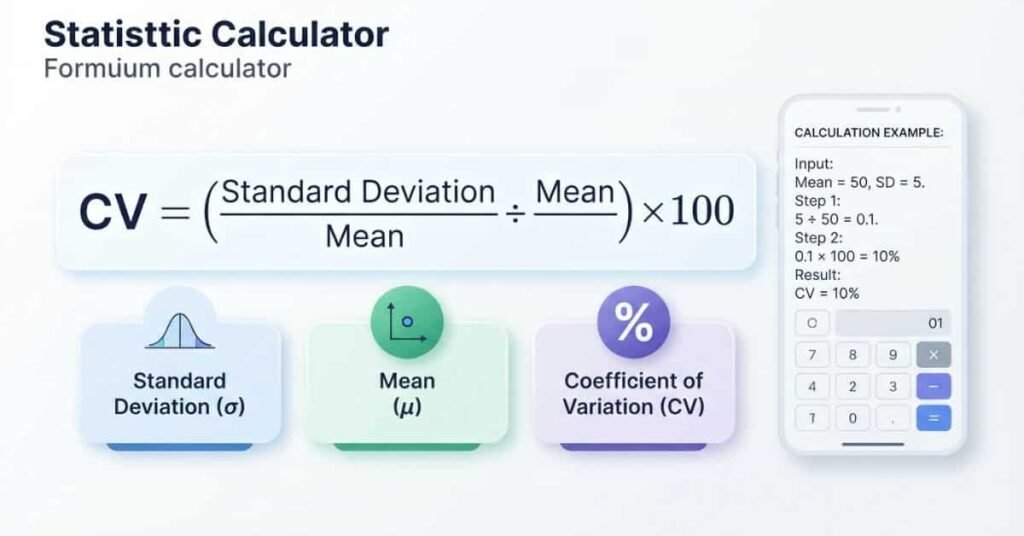
The coefficient of variation formula compares the standard deviation with the mean. When reported as a percentage, use this formula:
CV = (Standard Deviation ÷ Mean) × 100
Each part of the formula has a specific purpose.
Mean: The mean is the average value of the dataset. It provides the central value used for comparison.
Standard Deviation: Standard deviation measures how spread out the data values are around the mean. A larger standard deviation usually means greater absolute spread.
CV: The coefficient of variation shows how much variation exists relative to the mean. Multiplying the ratio by 100 converts it into a percentage.
For example, suppose a dataset has a mean of 50 and a standard deviation of 5. The calculation is (5 ÷ 50) × 100 = 10%.
This means the standard deviation equals 10% of the mean. The coefficient of variation calculator can perform this calculation automatically. You only need to enter the required values.
Try the same calculation with your own numbers using our free Coefficient of Variation Calculator for a quick and accurate result.
Why Is Coefficient of Variation Useful?
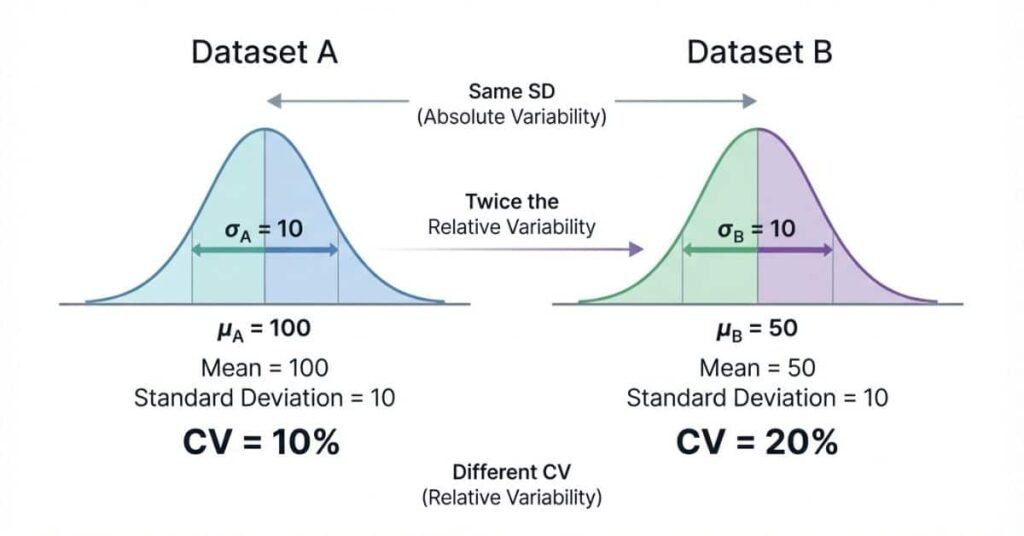
The coefficient of variation is useful because it measures relative variability, not just absolute spread. Standard deviation tells you how far values typically vary from the mean. However, it does not account for the size of that mean.
CV helps you compare datasets with different averages. It can also help compare measurements when their scales differ but their relative variability matters.
Consider these two datasets:
| Dataset | Mean | Standard Deviation | CV |
|---|---|---|---|
| Dataset A | 100 | 10 | 10% |
| Dataset B | 50 | 10 | 20% |
Both datasets have the same standard deviation of 10. Yet Dataset B has twice the relative variability.
Why? Its standard deviation is larger compared with its mean. CV makes this difference clear.
This makes CV useful in statistics, science, finance, laboratory research, and quality control. For example, researchers can use CV to compare the consistency of measurements with different average values.
Standard deviation remains useful when you need the actual spread in the original measurement units. CV becomes more useful when relative consistency matters.
How to Interpret Coefficient of Variation
To interpret coefficient of variation, focus on how large the CV is relative to the mean. A lower CV generally means less variability around the average. A higher CV generally means more variability relative to the average.
For example, a dataset with a 5% CV has less relative variability than one with a 20% CV. The 20% value shows that variation makes up a larger share of the dataset’s mean.
| CV | General Interpretation |
|---|---|
| 5% | Low relative variability |
| 10% | Relatively low variability |
| 20% | Moderate relative variability |
| 30%+ | Higher relative variability |
These values are general guidelines, not universal statistical thresholds. There is no single CV range that works for every industry or study.
When deciding how to interpret CV, consider the measurement, research field, data quality, and purpose of the analysis. Some fields may accept higher CV values, while others require tighter consistency.
So, how to interpret CV correctly? Compare it with appropriate datasets and consider the context. A high CV does not automatically mean poor data, and a low CV does not always mean better results.
What Is a Good Coefficient of Variation?
There is no single CV percentage that is universally considered good. A suitable coefficient of variation depends on the situation and the type of data.
When asking what is a good coefficient of variation, consider several factors:
- Industry: Different industries may have different expectations for variability.
- Type of measurement: Some measurements naturally show more variation than others.
- Research field: Scientific and laboratory studies may use field-specific standards.
- Data quality: Measurement methods and sampling can affect variability.
- Purpose of the analysis: The acceptable level depends on what you are trying to evaluate.
A lower CV generally means less variability relative to the mean. However, lower isn’t automatically better in every situation. Some processes naturally justproduce higher variation without indicating a problem.
For example, a 5% CV may be excellent for one measurement but unnecessary for another. The same CV can also have different meanings across different fields.
Instead of asking whether a CV is simply “good” or “bad,” compare it with appropriate standards for your field. Consider the measurement’s purpose and the expected level of natural variation.
Is Coefficient of Variation a Percentage?
Yes, the coefficient of variation is usually reported as a percentage. This format makes relative variability easier to understand and compare.
For example, suppose a dataset has a mean of 50 and a standard deviation of 5. Use the coefficient of variation formula:
CV = (5 ÷ 50) × 100 = 10%
The result means the standard deviation equals 10% of the mean. You can then compare this percentage with the CV of another suitable dataset.
The underlying ratio can also be written as a decimal. In this example, 5 divided by 50 equals 0.10. Multiplying by 100 expresses that same value as 10%.
So, should coefficient of variation be a percentage? In most practical statistical reporting, yes. Reporting CV as a percentage provides a clear way to communicate relative variability.
Remember that CV depends on the mean. A mean of zero makes the calculation undefined, while a mean close to zero can produce an unstable CV.
Coefficient of Variation vs. Standard Deviation
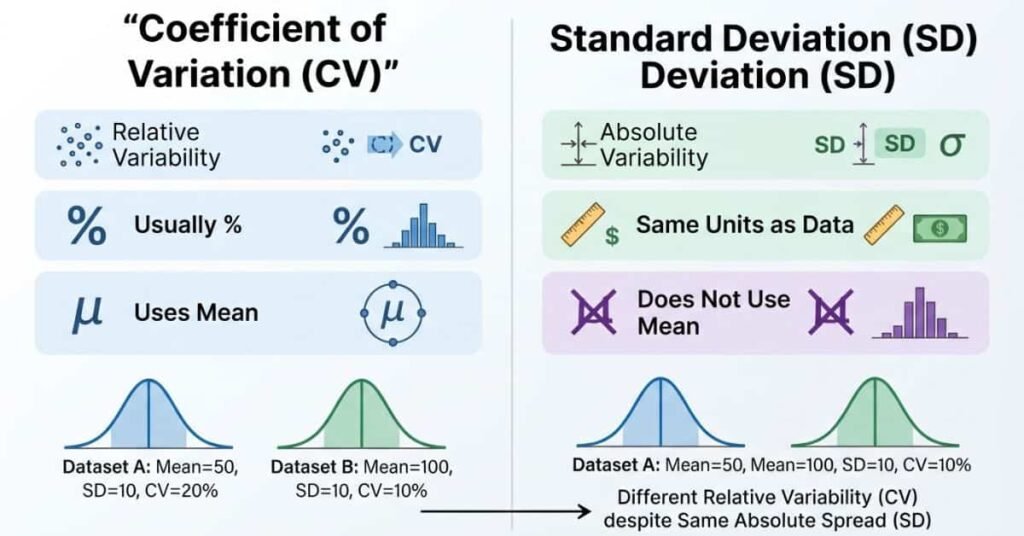
Coefficient of variation and standard deviation both describe variability. However, they answer different questions. Standard deviation measures the absolute spread of data, while CV measures relative variability compared with the mean.
| Feature | Coefficient of Variation | Standard Deviation |
|---|---|---|
| Measures | Relative variability | Absolute variability |
| Expressed as | Usually % | Same units as the data |
| Uses mean | Yes | No |
| Compares different scales | More useful | More limited |
Standard deviation is useful when you want to know how far values spread from the mean. CV is more useful when you want to compare relative variation between datasets with different means.
For example, Dataset A has a mean of 100 and an SD of 10. Its CV is 10%. Dataset B has a mean of 50 and the same SD of 10. Its CV is 20%.
Both datasets have identical absolute variation. However, Dataset B has twice the relative variability. This shows why CV can provide more useful context when comparing different means.
Coefficient of Variation Example
Let’s work through a simple coefficient of variation example. Suppose a dataset has a mean of 80 and a standard deviation of 8.
Start with the coefficient of variation formula:
CV = (Standard Deviation ÷ Mean) × 100
Now insert the values:
CV = (8 ÷ 80) × 100
CV = 10%
The coefficient of variation is therefore 10%. This means the standard deviation represents 10% of the dataset’s mean.
A 10% CV generally indicates relatively low variability in this example. However, you should not label every 10% CV as “good” without considering the field and purpose.
This example also shows why CV is easy to calculate. You only need the mean and standard deviation. For larger datasets, a coefficient of variation calculator can perform the calculation quickly.
Limitations of the Coefficient of Variation
The coefficient of variation is useful, but it does have important limitations. Understanding these limitations helps you avoid misleading comparisons and incorrect conclusions.
First, CV can be problematic when the mean is zero or very close to zero. A zero mean makes the formula undefined. A mean close to zero can produce an unusually large or unstable CV.
CV is generally most useful when the mean is meaningful and positive. If the mean is negative, interpreting CV as a percentage of the mean becomes less straightforward.
You should also avoid treating a higher CV as automatically “bad.” A higher value simply indicates greater relative variability. Whether that variation is acceptable depends on the field and purpose of the analysis.
Be careful when comparing datasets that measure fundamentally different things. A CV comparison is most meaningful when the measurements are suitable for relative comparison.
Finally, identify whether you are using sample or population standard deviation. The choice affects the CV calculation. Use the standard deviation that matches your statistical analysis.
Pro Tip: Check the mean, measurement type, and standard deviation method before comparing CV values. These details can change how you should interpret the result.
Conclusion
The coefficient of variation helps you understand variability relative to the mean. We covered its meaning, formula, interpretation, examples, and key limitations.
Understanding what is coefficient of variation can make statistical comparisons much easier. CV is especially useful when datasets have different means or scales. Remember that a lower CV generally means less relative variability. However, there is no universal CV value that always means “good” or “bad.”
Always consider the measurement, field, and purpose before interpreting a result. Also check the mean and the type of standard deviation used.
Ready to calculate CV? Try our free Coefficient of Variation Calculator for a quick result.
Share this guide with someone learning statistics, or explore more beginner-friendly statistical tools on our website.
Frequently Asked Questions
Find clear answers to common questions about the coefficient of variation, its formula, meaning, and interpretation.
The coefficient of variation (CV) measures relative variability in a dataset. It compares the standard deviation with the mean. CV is usually reported as a percentage. A lower CV generally indicates less variation relative to the mean.
CV tells you how large the variation is compared with the average value. It helps compare relative variability between suitable datasets. For example, a 20% CV indicates more relative variation than a 5% CV.
CV stands for Coefficient of Variation. It is a statistical measure of relative variability. Researchers commonly use CV to compare variation across datasets with different means.
There is no universal CV percentage that always counts as good. An acceptable value depends on the industry, measurement, research field, and analysis purpose. A lower CV isn’t automatically better.
Yes, CV is usually reported as a percentage. You calculate it by dividing the standard deviation by the mean and multiplying by 100. For example, 5 ÷ 50 × 100 equals 10%.
Neither is automatically better. A lower CV generally means less relative variability. However, the acceptable level depends on the field, measurement, and purpose of the analysis.
The standard percentage formula is CV = (Standard Deviation ÷ Mean) × 100. Use the appropriate sample or population standard deviation for your analysis.
Standard deviation measures absolute variability in the original data units. CV measures relative variability compared with the mean. CV is usually expressed as a percentage, making relative comparisons easier.
CV is normally nonnegative when the mean is positive because standard deviation cannot be negative. If the mean is negative, the mathematical ratio can become negative. Such a result usually needs careful interpretation.
CV becomes undefined when the mean equals zero because the formula requires division by the mean. A mean close to zero can also produce an unstable or unusually large CV.

We are the StatisticsTools.com Development Team, dedicated to building accurate, easy-to-use statistical calculators and educational resources for students, educators, researchers, and professionals.
Our mission is to make statistics simple by providing free, reliable tools for data analysis, probability, hypothesis testing, regression, and other statistical calculations. We also create practical guides that explain statistical concepts in a clear and easy-to-understand way.
At StatisticsTools.com, we are continuously improving our platform by adding new calculators and educational resources to help users solve statistical problems quickly and confidently.