
Table of Contents
Introduction
How can you compare the variation in two datasets when their averages are very different?
The coefficient of variation makes that comparison easier by measuring variability relative to the mean. Learning how to calculate coefficient of variation is useful in statistics, research, business, finance, and science.
For beginners in the USA, the calculation may look complicated at first. However, it only requires the mean and standard deviation. Once you understand the formula, you can calculate CV by hand or with a calculator.
In this guide, you will learn how to calculate CV step by step. We will explain the coefficient of variation formula in simple terms. You will also see clear numerical examples using real data values.
We will cover how to find coefficient of variation from a dataset. You will also learn how to interpret the result and avoid common mistakes.
If you already know the mean and standard deviation, the calculation becomes even faster. By the end, you will know exactly how to calculate CV and when to use it.
How to Calculate Coefficient of Variation
To learn how to calculate coefficient of variation, start with the mean and standard deviation. The formula is simple:
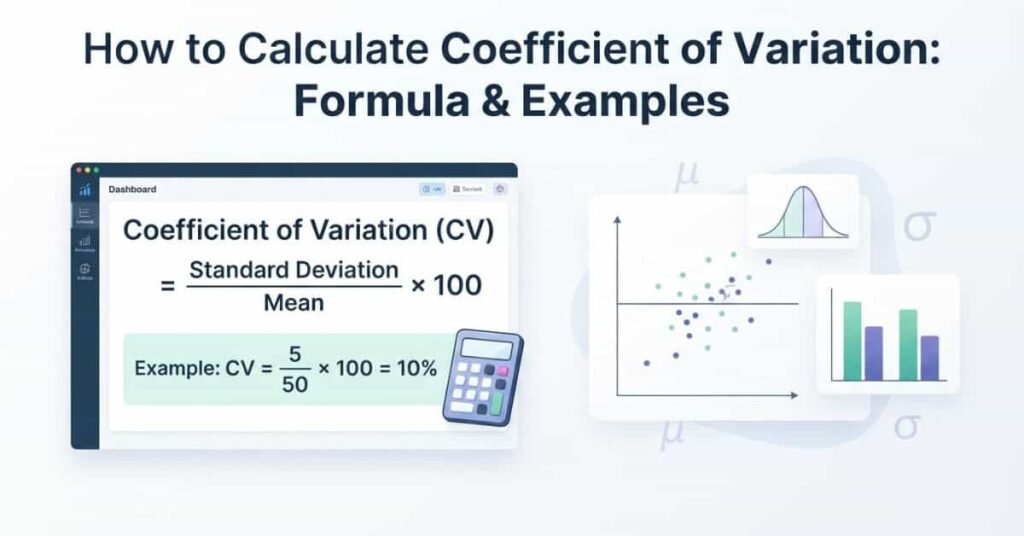
CV = (Standard Deviation ÷ Mean) × 100
The mean is the average value in your dataset. It shows the central value around which the data is grouped. The standard deviation measures how much the data varies around the mean.
The coefficient of variation (CV) shows relative variability. It compares the standard deviation with the mean and usually expresses the result as a percentage.
For example, suppose a dataset has a mean of 50 and a standard deviation of 5. You can calculate CV as follows:
CV = (5 ÷ 50) × 100 = 10%
So, the coefficient of variation is 10%. A higher CV indicates more relative variation, while a lower CV indicates less relative variation.
Quick takeaway: You only need the mean and standard deviation to calculate CV. Divide the standard deviation by the mean, then multiply by 100.
Steps to Calculate Coefficient of Variation
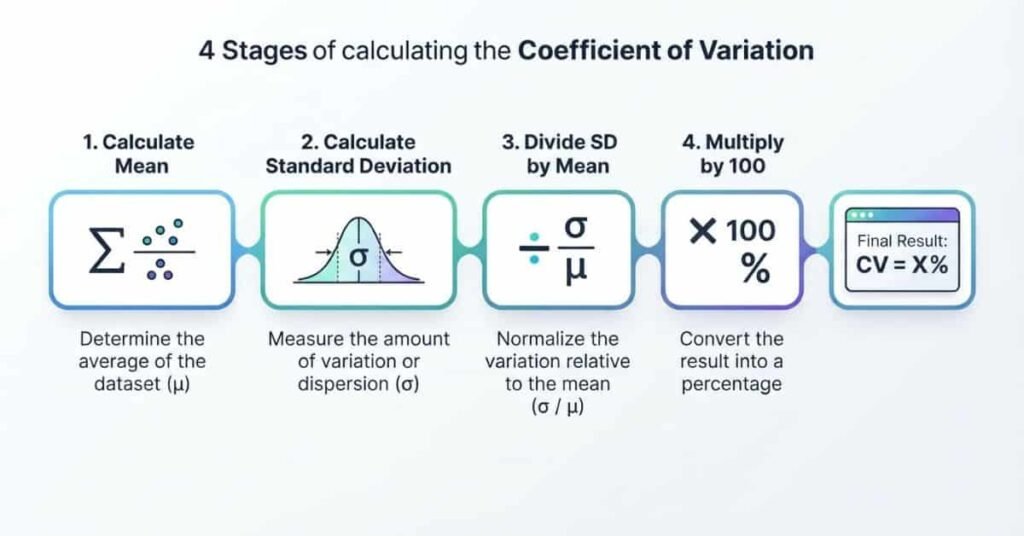
Calculating the coefficient of variation takes four simple steps. You first find the mean and standard deviation, then apply the formula.
Step 1: Calculate the Mean
First, find the average of all values in your dataset. Add every value together, then divide the total by the number of values.
Mean = Sum of values ÷ Number of values
Step 2: Calculate the Standard Deviation
Next, calculate the standard deviation to measure how spread out the data is. Use the sample standard deviation for sample data. Use the population standard deviation when your data represents the entire population.
Choosing the correct standard deviation matters because it affects the final CV.
Step 3: Divide Standard Deviation by Mean
Once you have both values, divide the standard deviation by the mean.
SD ÷ Mean
This gives you the coefficient of variation as a decimal.
Step 4: Multiply by 100
Finally, multiply the result by 100 to express CV as a percentage.
CV = (SD ÷ Mean) × 100
Coefficient of Variation Example
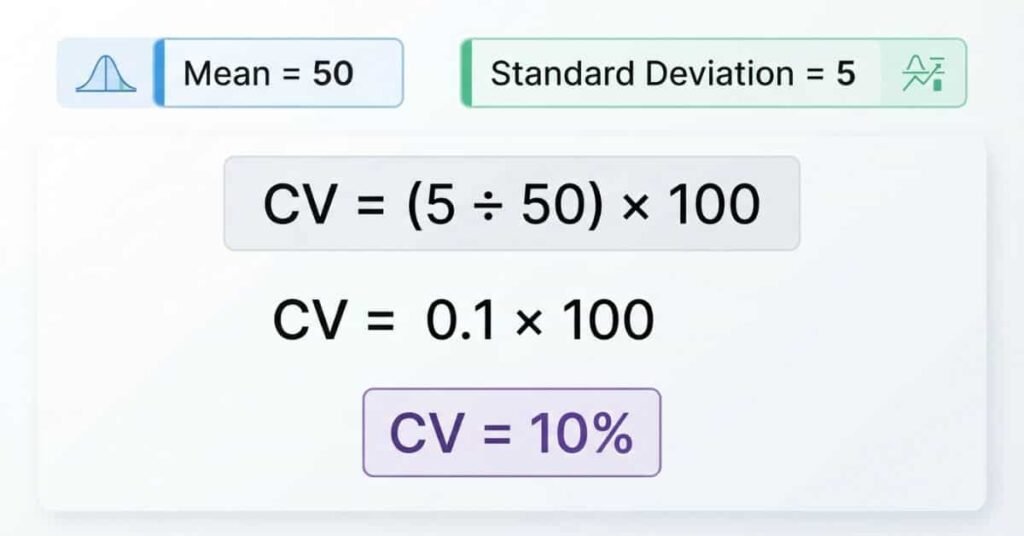
Let’s calculate CV using a simple example. Suppose you already know the mean and standard deviation.
Given:
- Mean = 50
- Standard deviation = 5
Now apply the coefficient of variation formula:
CV = (5 ÷ 50) × 100
CV = 10%
Therefore, the coefficient of variation is 10%.
This means the standard deviation equals 10% of the mean. The calculation becomes quick once you know the mean and standard deviation.
Quick takeaway: Divide the standard deviation by the mean, then multiply by 100.
How to Calculate CV From Mean and Standard Deviation
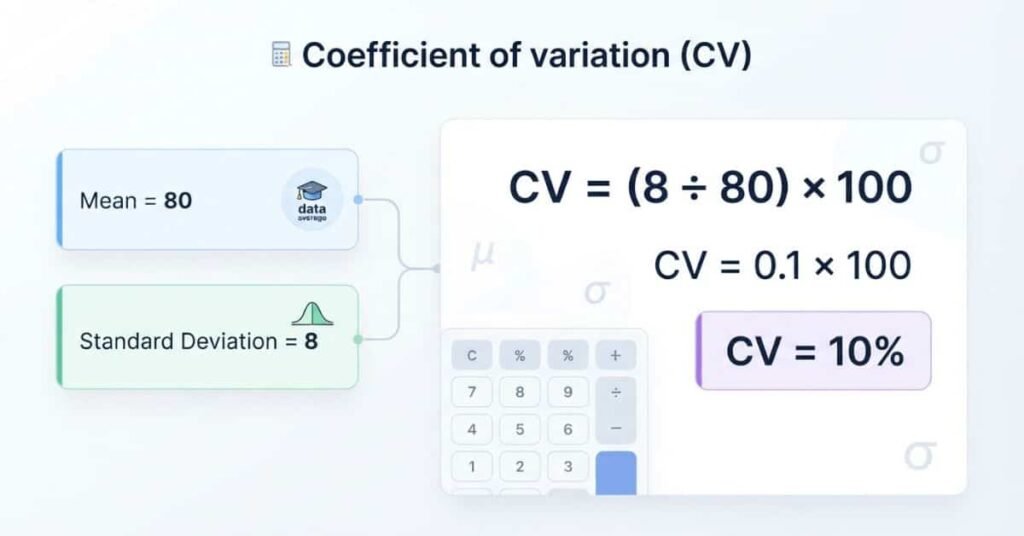
Once you know the mean and standard deviation, calculating CV requires only one calculation. You do not need to repeat the full dataset calculation.
Use this formula:
CV = (Standard Deviation ÷ Mean) × 100
For example, suppose the mean is 80 and the standard deviation is 8.
CV = (8 ÷ 80) × 100 = 10%
Therefore, the coefficient of variation is 10%. This is the simplest way to learn how to calculate coefficient of variation from standard deviation when both values are already available.
If you need to calculate the standard deviation first, use the method that matches your data. Then apply the CV formula. This covers how to calculate standard deviation and coefficient of variation, as well as how to calculate mean, standard deviation, and coefficient of variation from raw data.
How to Find Coefficient of Variation From a Data Set
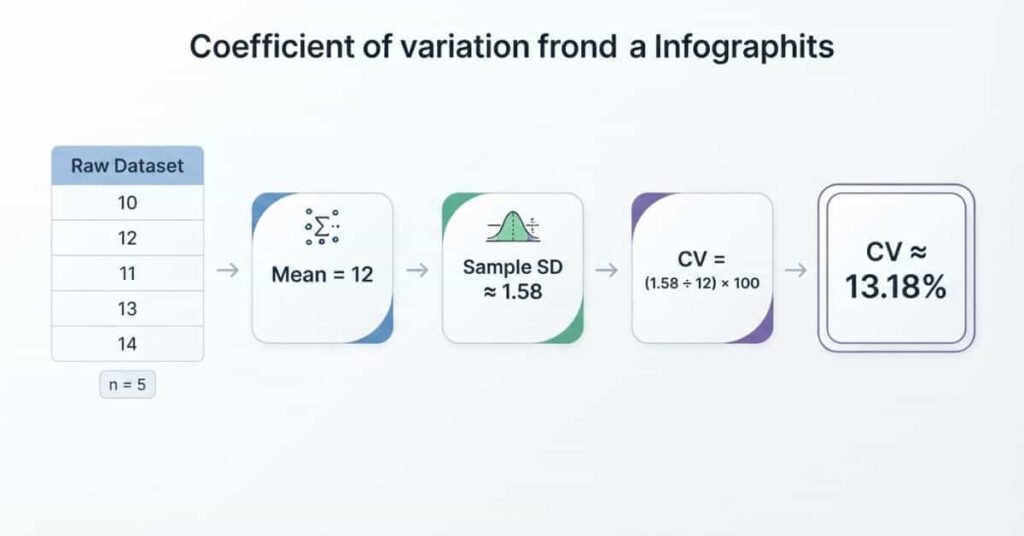
If you only have raw data, you must first calculate the mean and standard deviation. Consider this dataset:
10, 12, 11, 13, 14
Step 1: Find the Mean
Add the values and divide by the number of observations:
Mean = (10 + 12 + 11 + 13 + 14) ÷ 5
Mean = 12
Step 2: Find the Standard Deviation
For this example, assume the values represent a sample. The sample standard deviation is approximately:
SD = 1.58
If the values represent the entire population, use the population standard deviation instead.
Step 3: Apply the CV Formula
Now divide the standard deviation by the mean:
CV = (1.58 ÷ 12) × 100
CV ≈ 13.17%
Using the unrounded standard deviation gives approximately 13.18%.
Step 4: Interpret the Result
The coefficient of variation is about 13.18%. It shows the dataset has relative variability equal to about 13.18% of its mean.
This step-by-step method shows how to find coefficient of variation when you start with raw data rather than known summary values.
How to Calculate Coefficient of Variation by Hand
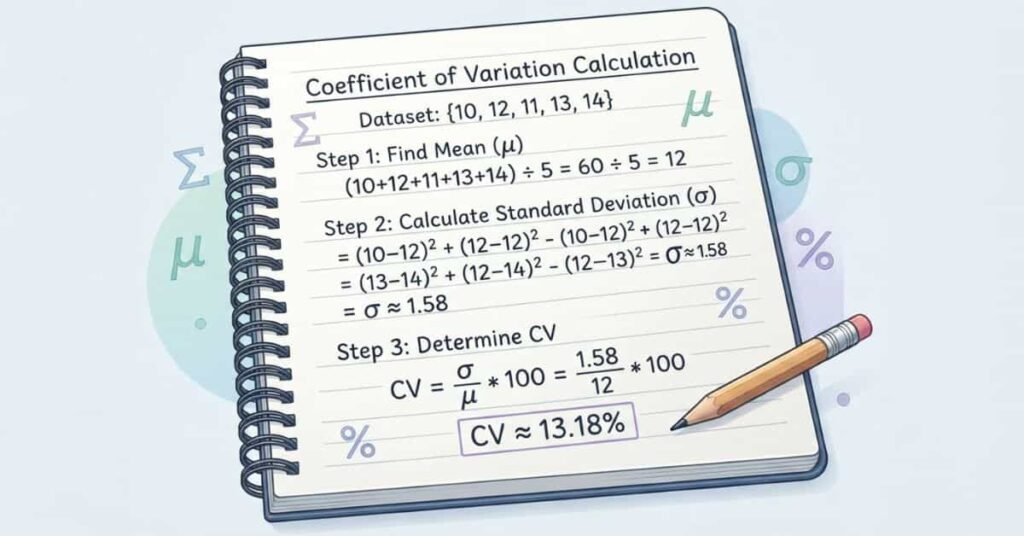
You can calculate CV by hand without Excel or specialized software. You only need basic arithmetic and the correct standard deviation.
Use this simple sequence:
Dataset → Mean → Standard Deviation → CV Formula → Result
For example, consider this dataset:
10, 12, 11, 13, 14
First, calculate the mean:
Mean = (10 + 12 + 11 + 13 + 14) ÷ 5 = 12
Next, calculate the sample standard deviation. For this dataset, it is approximately 1.58.
Now apply the coefficient of variation formula:
CV = (SD ÷ Mean) × 100
CV = (1.58 ÷ 12) × 100
CV ≈ 13.18%
Therefore, the coefficient of variation is approximately 13.18%.
This manual method shows exactly how to calculate coefficient of variation by hand. Keep extra decimal places during your calculations for a more accurate final result.
Pro Tip
Always identify whether your data is a sample or population before calculating standard deviation. Using the wrong method changes the CV.
How to Interpret the Result
The coefficient of variation helps you understand relative variability. A lower CV generally means the data varies less compared with its mean. A higher CV indicates greater relative variation.
For example:
- CV = 5% → relatively low variation
- CV = 25% → greater relative variation
However, there is no universal cutoff for a “good” or “bad” CV. The right interpretation depends on the field, dataset, and purpose of the analysis.
For instance, a CV considered acceptable in one scientific field may be high in another. Always compare CV values within a meaningful context.
When comparing datasets, a lower CV can indicate greater consistency relative to the mean. A higher CV suggests more variation relative to the mean.
For a deeper explanation of CV and its uses, see your What Is Coefficient of Variation? article.
Is Coefficient of Variation a Percentage?
Usually, yes. The coefficient of variation is commonly reported as a percentage because this makes relative variability easier to understand and compare.
First, divide the standard deviation by the mean:
SD ÷ Mean
This produces a decimal value. Multiply that value by 100 to express CV as a percentage.
For example:
SD ÷ Mean = 0.10
Then:
0.10 × 100 = 10%
So, a coefficient of variation of 0.10 can be reported as 10%. Both values represent the same relative variability. The percentage format is simply easier for most readers to interpret.
Can You Calculate Coefficient of Variation With a Calculator?
Yes. You can calculate coefficient of variation quickly once you know two values: the mean and standard deviation.
Use this formula:
CV = (SD ÷ Mean) × 100
For example, if the mean is 80 and the standard deviation is 8:
CV = (8 ÷ 80) × 100 = 10%
You can also save time with our Coefficient of Variation Calculator. Enter your mean and standard deviation, and the calculator will calculate CV instantly.
Pro Tip
Check your mean before calculating CV. A zero or very small mean can make the result undefined or misleading.
Coefficient of Variation vs. Standard Deviation
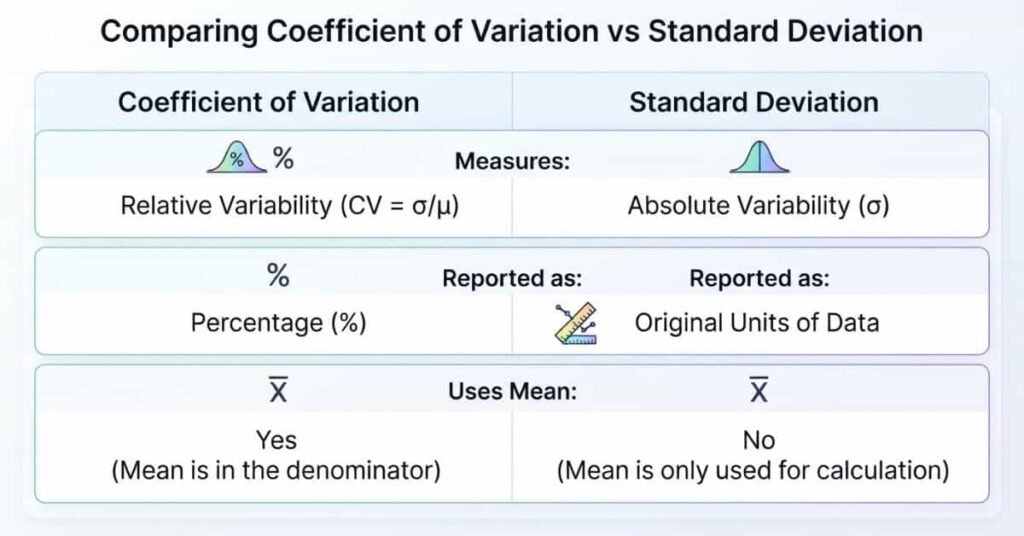
Coefficient of variation and standard deviation both describe variability, but they answer different questions.
| Coefficient of Variation | Standard Deviation | |
|---|---|---|
| Measures | Relative variability | Absolute variability |
| Usually reported as | Percentage | Original units |
| Uses mean | Yes | No |
Standard deviation shows how far values typically spread from the mean in the dataset’s original units. CV puts that variation into context by comparing standard deviation with the mean.
Use standard deviation when you need to understand the actual spread. Use CV when you need to compare relative variation between datasets with different means or scales.
For a deeper explanation, see the What Is Coefficient of Variation? article.
Common Mistakes When Calculating CV
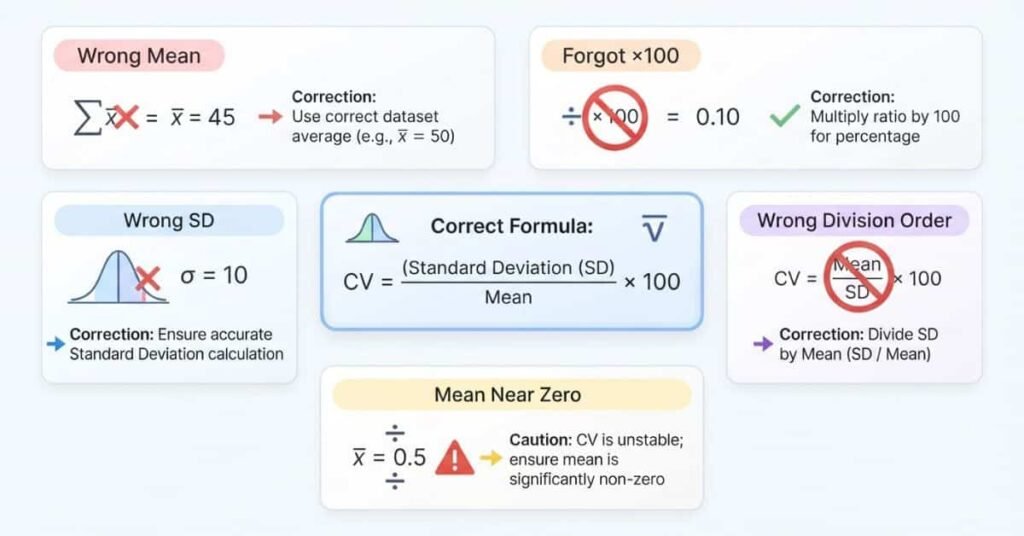
Even though the CV formula is simple, small mistakes can produce incorrect results. Watch for these common errors.
Using the Wrong Mean
CV depends directly on the mean. Make sure you calculate the correct mean for the dataset before applying the formula.
Forgetting to Multiply by 100
The ratio SD ÷ Mean gives CV as a decimal. Multiply it by 100 when reporting CV as a percentage.
For example:
0.10 × 100 = 10%
Using the Wrong Standard Deviation
Check whether your data represents a sample or an entire population. Use the corresponding sample or population standard deviation.
Dividing in the Wrong Order
Always divide the standard deviation by the mean:
SD ÷ Mean
Do not reverse the calculation:
Mean ÷ SD
Using CV When the Mean Is Zero or Near Zero
CV is undefined when the mean equals zero. A mean close to zero can also make CV extremely large or unstable.
In these situations, CV may provide a misleading measure of relative variability. Consider the data and context before interpreting the result.
Pro Tip
Keep the full precision of your standard deviation until the final calculation. Round the final CV instead of rounding too early.
How to Calculate Coefficient of Variation in Different Tools
You can calculate CV manually, but spreadsheet and statistical tools can make repeated calculations faster.
Excel
Excel can calculate the mean and standard deviation with built-in functions. You can then apply the CV formula to those results.
See How to Calculate Coefficient of Variation in Excel for a step-by-step guide.
Google Sheets
Google Sheets also provides functions for calculating the mean and standard deviation. You can use those values to calculate CV.
See How to Calculate Coefficient of Variation in Google Sheets for detailed instructions.
R, Python, and SPSS
Statistical software such as R, Python, and SPSS can also calculate CV. These tools are useful when working with larger datasets or repeated analyses.
For a simple calculation, however, the basic formula remains the same:
CV = (SD ÷ Mean) × 100
Conclusion
Calculating coefficient of variation becomes simple once you know the mean and standard deviation. You can divide the standard deviation by the mean, then multiply by 100.
This guide explained how to calculate coefficient of variation step by step. You also learned how to calculate CV by hand, interpret the result, and avoid common calculation mistakes.
Remember that CV usually appears as a percentage. A lower CV indicates less relative variability, while a higher CV indicates greater relative variability. Always consider your field and data before judging the result.
Calculate Coefficient of Variation
Skip the manual calculation and get your coefficient of variation instantly. Enter your mean and standard deviation into our calculator for a quick result.
[Use the Coefficient of Variation Calculator]
Frequently Asked Questions
Calculate the mean and standard deviation first. Then divide the standard deviation by the mean and multiply by 100. CV = (SD ÷ Mean) × 100
If you already know the mean and standard deviation, divide SD by the mean. Multiply the result by 100 to express CV as a percentage.
Start with your dataset and calculate its mean and standard deviation. Then use the coefficient of variation formula to find the relative variability.
The standard formula divides the standard deviation by the mean. Multiply the result by 100 when reporting CV as a percentage. CV = (Standard Deviation ÷ Mean) × 100
You also need the mean. Divide the standard deviation by the mean, then multiply by 100. For example, SD = 8 and Mean = 80 gives a CV of 10%.
Calculate the mean, find the appropriate standard deviation, and divide SD by the mean. Multiply the result by 100. No spreadsheet is required.
CV is commonly reported as a percentage, but the underlying ratio is dimensionless. For example, 0.10 becomes 10% after multiplying by 100.
A high CV indicates greater relative variability compared with the mean. However, there is no universal threshold for a high or low CV.
CV is undefined when the mean equals zero because division by zero is not possible. A mean close to zero can also make CV unstable or misleading.

We are the StatisticsTools.com Development Team, dedicated to building accurate, easy-to-use statistical calculators and educational resources for students, educators, researchers, and professionals.
Our mission is to make statistics simple by providing free, reliable tools for data analysis, probability, hypothesis testing, regression, and other statistical calculations. We also create practical guides that explain statistical concepts in a clear and easy-to-understand way.
At StatisticsTools.com, we are continuously improving our platform by adding new calculators and educational resources to help users solve statistical problems quickly and confidently.